Abstract
Reactive transport in saturated/unsaturated porous media is numerically upscaled to the spacetime scale of a hypothetical measurement through coarse grained space-time (CGST) averages. The one-dimensional reactive transport is modeled at the fine-grained Darcy scale by the actual number of molecules involved in reactions which undergo advective and diffusive movements described by global random walk (GRW) simulations. The CGST averages verify identities similar to a local scale balance equation which allow us to derive expressions for the flow velocity and the intrinsic diffusion coefficient in terms of averaged microscopic quantities. The latter are further used to verify the CGST-GRW numerical approach. The upscaling approach is applied to biodegradation processes in saturated aquifers and variably saturated soils and the CGST averages are compared to classical volume averages. One finds that if the process is characterized by slow variations in time, as in homogeneous systems or in case of observations of reactive transport in heterogeneous aquifers made at large times or far away from the contaminant source, the differences between the two averages are negligible. Instead, the differences are significant if the averages are computed close to thesource at early times, in case of aquifer simulations, and can be extremely large in simulations of biodegradation in soils. In the latter case, the volume average is totally inappropriate as model for experimental measurements, leading for instance to overestimations by 100% of the CGST average.
xxx
Reactive transport in saturated/unsaturated porous media is numerically upscaled to the space–time scale of a hypothetical measurement through coarse-grained space–time (CGST) averages. The reactive transport is modeled at the fine-grained Darcy scale by the actual number of molecules involved in reactions which undergo advective and diffusive movements described by global random walk (GRW) simulations. The CGST averages verify identities similar to a local balance equation which allow us to derive expressions for the flow velocity and the intrinsic diffusion coefficient in terms of averaged microscopic quantities. The latter are further used to verify the CGST-GRW numerical approach. The upscaling approach is applied to biodegradation processes in saturated aquifers and variably saturated soils and the CGST averages are compared to classical volume averages. One finds that if the process is characterized by slow variations in time, as in homogeneous reaction systems, the differences between the two averages are negligible. Instead, the differences are significant and can be extremely large in simulations of time-dependent biodegradation processes in both variably saturated soils and saturated aquifers.
Authors
Nicolae Suciu
Tiberiu Popoviciu Institute of Numerical Analysis, Romanian Academy, Cluj-Napoca, Romania
Florin A. Radu
Department of Mathematics, University of Bergen, Allegaten 41, 5007 Bergen, Norway
Iuliu Sorin Pop
Data Science Institute, Hasselt University, Campus Diepenbeek, 3590 Diepenbeek, Belgium
Keywords
Space-time upscaling, Global random walk, Reactive transport, Richards equation MSC: 76S05, 35K57, 86A05, 65C35
xxx
Cite this paper as:
N. Suciu, F.A. Radu, I.S. Pop, Space-time upscaling of reactive transport in porous media, Advances in Water Resources, 176 (2023), art. no. 104443, https://doi.org/10.1016/j.advwatres.2023.104443
N. Suciu, F.A. Radu, I.S. Pop, Space-time upscaling of reactive transport in porous media, Arxiv: https://doi.org/10.48550/arXiv.2112.10692
About this paper
Journal
Advances in Water Resources
Publisher Name
Elsevier Ltd.
Print ISSN
0309-1708
Online ISSN
Not available yet.
Google Scholar Profile
Space-time upscaling of reactive transport in porous media
Abstract
Reactive transport in saturated/unsaturated porous media is numerically upscaled to the space-time scale of a hypothetical measurement through coarse-grained space-time (CGST) averages. The reactive transport is modeled at the fine-grained Darcy scale by the actual number of molecules involved in reactions which undergo advective and diffusive movements described by global random walk (GRW) simulations. The CGST averages verify identities similar to a local balance equation which allow us to derive expressions for the flow velocity and the intrinsic diffusion coefficient in terms of averaged microscopic quantities. The latter are further used to verify the CGST-GRW numerical approach. The upscaling approach is applied to biodegradation processes in saturated aquifers and variably saturated soils and the CGST averages are compared to classical volume averages. One finds that if the process is characterized by slow variations in time, as in homogeneous reaction systems, the differences between the two averages are negligible. Instead, the differences are significant and can be extremely large in simulations of time-dependent biodegradation processes in both variably saturated soils and saturated aquifers.
Keywords:
Space-time upscaling, Global random walk, Reactive transport, Richards equation MSC: 76S05, 35K57, 86A05, 65C351 Introduction
Concentrations measured in soil experiments as well as in samples pumped from monitoring wells or collected by multilevel samplers are necessarily space averages over the support scale of the sampling procedure and measuring device [Mailloux et al.,, 2003, Teutsch et al.,, 2000, Bayer-Raich et al.,, 2004]. The sampling volume enters as an important parameter in analytical and numerical models because of its impact on the moments and the probability distribution of the uncertain concentration transported in heterogeneous natural porous media [Andričević,, 1998, Schwede et al.,, 2008, Tonina and Belin.,, 2008, Srzic et al.,, 2013, de Barros and Fiori,, 2014].
The spatial average over the sampling volume is accounted for in different ways depending on modeling approaches. In analytical and semianalytical approaches, the average concentration is an integral of a continuous field of concentrations [Andričević,, 1998, Schwede et al.,, 2008] or related probability densities [de Barros and Fiori,, 2014]. The same procedure is applied to both resident and flux-weighted concentrations [Schwede et al.,, 2008]. When the purpose is to estimate probability distributions, the resident concentration is preferred [Schwede et al.,, 2008, de Barros and Fiori,, 2014]. The resident concentrations solve local balance equations for reactive transport which are the starting point in deriving evolution equations for the concentration probability density function [Suciu et al.,, 2015] and the corresponding concentration moments equations [Schüler et al.,, 2016]. These equations describe the statistics of the concentration without considering a sampling volume, which corresponds to a point sampling in volume averaging approaches [Tonina and Belin.,, 2008, Srzic et al.,, 2013]. However, by averaging the solution of the local balance equation with a spatial filter, a filtered density function approach is obtained, which explicitly takes into account the sampling volume, determined by the width of the spatial filter [Suciu et al.,, 2016].
In the case of discrete descriptions of the transport process, such as sequential particle tracking [Caroni and Fiorotto,, 2005, Srzic et al.,, 2013, Tonina and Belin.,, 2008, Wright et al.,, 2021] and global random walk (GRW) simulations [Suciu et al.,, 2016, Suciu,, 2019, Suciu et al.,, 2021, Suciu and Radu,, 2022], concentrations are measured by counting particles in the sampling volume. When using moderate numbers of particles, as in particle tracking approaches, the traditional counting particles produces non-smooth fields. This issue is overcome in kernel density estimations [Fernàndez-Garcia and Sanchez-Vila,, 2011, Sole-Mari and Fernàndez-Garcia,, 2018, Sole-Mari et al.,, 2019] by weighting the contributions of the individual particles with smooth kernel functions. The resulting kernel estimates are smooth concentration fields and concentration derivatives/gradients. The parameter of the kernel function is a measure of the support volume which defines the region over which a particle influences the estimate. The optimal volume support can be evaluated as function of the number of particles and it has been shown that it goes to zero for infinite number of particles [Fernàndez-Garcia and Sanchez-Vila,, 2011]. The need of an optimal support volume is thus related to the relatively small numbers of particles used in particle tracking approaches, which is limited by the computational resources. In GRW methods which, instead of tracking individual particles, move groups of particles over the sites of a regular lattice, particles can be associated to molecules and a mole of solute is represented by Avogrado’s number [Suciu and Radu,, 2022].
The relation between the two spatial averaging procedures, by integrating continuous fields and by counting particles, is not trivial. In fact, this is equivalent to passing from a microscopic level of description to a macroscopic one. Such connections can be rigorously established if the spatial sampling is replaced by a space-time average [Suciu,, 2001, Vamoş,, 2007].
Considering the time scale along with the support volume is imposed by the obvious fact that any measurement is also a time average and hydrological measurements are no exception [Destouni and Graham,, 1997, Andričević,, 1998]. Even if some flow and transport conditions (e.g. small spatial scale of concentration fluctuations [Andričević,, 1998] or steady state transport [Schwede et al.,, 2008]) justify a sampling volume approach which disregards the measurement time scale, in most cases both the spatial and temporal scales specific to the observation method [Bayer-Raich et al.,, 2004, Berkowitz,, 2021, Destouni and Graham,, 1997] have to be considered.
The influence of the observation method on the expected value and the variance of the locally measured concentrations has been modeled in [Destouni and Graham,, 1997] by time averages of Lagrangian concentration representations. The proposed methodology can be used for either unsaturated or saturated flow conditions and for different types of observation methods. The temporal scale may be related to a spatial scale, as for instance for constant water volume sampling or for constant soil sample length. But the temporal scale may also be independent of the spatial scale, as in case of monitoring wells, where it is related to the pumping time [Bayer-Raich et al.,, 2004], or in lysimeter experiments [Dabrowska and Rykala,, 2021], where the relevant scale is the effluent collection time. The analysis based on temporal averages presented in [Destouni and Graham,, 1997] does not consider the effect of the spatial averaging and the results are consistent with those reported in previously published volume sampling studies.
A theoretical approach based on spatial and temporal averages was developed to transform microscale balance equations into macroscopic equations [He and Sykes,, 1996]. The basic assumption in this approach is the existence of differential equations which describe the transport of the volumetric density of an extensive physical quantity at the microscale. The averaging domain consists of the set product between a representative elementary volume which may vary in space and time and a variable timescale. The space-time averaging domain can thus be thought of as a generalization of the classical “fluid molecule”. Assuming the existence of the solution of the microscale equation, averaging theorems which relate derivatives of averages to averages of derivatives are proved and further used to derive the macroscopic equation for multiphase transport in porous media [Cushman,, 1983, He and Sykes,, 1996]. This equation is not closed and constitutive relations are needed to formulate well-posed problems.
Most recent papers on averaging procedures for porous media do not consider the temporal averaging, focusing mainly on volume averaging theorems for multiphase systems (see [Gray and Miller.,, 2013] and references therein). Spatial averaging procedures are used, for instance, to formulate macroscopic equations for multiphase transport [Gray et al.,, 2015], to understand how the internal structure of a two-fluid porous medium system influences the macroscale state [McClure et al.,, 2017], to account for dependencies between the size of the averaging volume and the macroscale in derivations of Darcy’s law from Navier-Stokes equations [Nordbotten et al.,, 2007], as well as in upscaling transport with Monod reactions to obtain effective equations for the macroscale [Heße et al.,, 2009].
Important achievements in deriving upscaled models for porous media were obtained by using homogenization techniques [Hornung,, 1996] which, unlike direct volume or spatio-temporal averaging, lead to closed upscaled equations with macroscopic coefficients completely determined by solving unit-cell problems [Auriault and Adler,, 1995]. Examples encompass but are not limited to, derivation of the Darcy scale model for precipitation and dissolution in porous media [Kumar et al.,, 2016], modeling injection of cold water in geothermal reservoirs [Bringedal et al.,, 2016], upscaling flow by homogenization methods for non-periodic and random parameters of the subsurface system [Nolen et al.,, 2008]. The concept of spatio-temporal upscaling in the context of homogenization by multiple-scale expansions, initially developed to study linear equations with coefficients oscillating in both space and time [Bensoussan et al.,, 2011], has been extended to nonlinear diffusion equations [Akagi and Oka,, 2020] and to reactive transport in porous media driven by oscillating pore water velocity [Van Duijn and van der Zee,, 2018]. In this approach, spatial and temporal scales are necessarily related, which could be a limitation of the spatio-temporal homogenization from the point of view of engineering applications. Another inconvenience is that the spatial and temporal scales are related to the inverse of the small parameter of the homogenization problem and the macroscopic description obtained when this parameter goes to zero cannot be directly related to the scales of measurement instruments and methods [Destouni and Graham,, 1997, Bayer-Raich et al.,, 2004] or to the spatial and temporal scales of the hydrological processes [Skøien et al.,, 2003].
In both direct spatio-temporal averaging and homogenization approaches the “microscopic” state is given by continuous fields. The alternative “counting particles” averaging approach requires a microscopic description given by trajectories of physical or computational particles. Assuming that the heterogeneity of the subsurface system can be modeled by random functions, a “microscopic” description corresponding to the local, Darcy scale of the transport process is given by trajectories of diffusion in random velocity fields [Suciu,, 2019] modeled numerically by particle tracking [Wright et al.,, 2021] or GRW algorithms [Suciu et al.,, 2021]. A general method to obtain a macroscopic description at spatio-temporal scales that can be directly related to those of the measurements and hydrological observations is the coarse-grained (CG) description of corpuscular systems through space-time (ST) averages [Vamoş et al.,, 1996]. The CGST approach also yields unclosed macroscopic equations but, since a complete microscopic description is available, it provides a frame to investigate the structure of the constitutive relations through numerical simulations [Vamoş et al.,, 1997].
Upscaling reactive transport in subsurface hydrological systems aims at obtaining models that can account for small scale processes in predicting the fate of contaminants at larger scales and in designing remediation strategies for contaminated sites. Solutions proposed so far, based on either Eulerian approaches [Porta et al.,, 2012] or on particle tracking transport models combined with Eulerian descriptions of the reactions [Wright et al.,, 2021] are essentially volume averaging methods. However, it has been argued that temporal fluctuations of reacting species concentrations due to the extrinsic noise resulted from the variability of the chemical environment and of the transport process [Aquino and Dentz,, 2017] propagate from local to larger spatial scales and at least an implicit temporal averaging must also be included in upscaling reactive transport [Berkowitz,, 2021]. It is further argued in [Berkowitz,, 2021] that the temporal information can be included through a continuous-time random walk approach, with a power-law distribution of transition times calibrated from measurements, which accounts for temporal effects over a range of time scales.
The CGST method offers the perspective of explicitly relating the upscaled concentrations to the spatio-temporal scales of interest. The fine-grained concentrations are represented microscopically by the actual number of molecules involved in reactions, their advective-diffusive movement being described by simple discrete-time random walk processes modeled with GRW algorithms [Suciu and Radu,, 2022]. This molecular description implicitly accounts for spatio-temporal fluctuations produced by inhomogeneities of reaction and transport parameters. Moreover, by using integrated flow and transport GRW solvers for unsaturated/saturated porous media [Suciu et al.,, 2021] the CGST approach can be applied to upscaling contaminant transport in both soil and aquifer systems.
In this article we propose a CGST upscaling approach using microscopic descriptions consisting of one- and two-dimensional GRW simulations of the reactive transport at Darcy scale. General statistical mechanics results on CGST averaging are presented in Section 2. In Section 3, theoretical formulas for the flow velocity and the intrinsic diffusion coefficient are derived as corollaries of the general result and are used to verify the Matlab codes designed for the numerical space-time upscaling. Further, in Section 4 the CGST approach is applied to various one-dimensional problems of reactive transport solved by GRW algorithms, with emphasis on biodegradation processes in saturated and unsaturated natural porous media. Two-dimensional codes for CGST upscaling are verified and applied to biodegradation in variably saturated soils in Section 5. The main results and summarized in Section 6. The proof of main result presented in Section 2 is given in A and B illustrates the influence of the space-time scale on the discrepancy between volume and CGST averages. The codes implemented in Matlab used in this study are stored in the Git repository SpaceTimeUpscaling [Suciu et al., 2023a, ].
2 Coarse-grained space-time averages
The CGST method allows continuous modeling of corpuscular systems, without the need to use the vague notion of “fluid particle” which is small enough to be infinitesimal with respect to the size of the macroscopic system, but large enough to contain many molecules in local thermodynamic equilibrium. Continuous macroscopic fields and balance equations can be derived under the only assumption that a system of particles (e.g. molecules and other physical particles, or computational particles used in GRW and particle tracking simulations) possesses a kinematic microscopic description through piecewise analytic time functions. A general proof of this result has been obtained in [Vamoş et al.,, 1996] by considering CGST averages over spheres and symmetric time intervals. Proofs for one-dimensional systems were presented in [Vamoş et al.,, 1997, 2000] and a general result for averaging on hypercubes in the phase space of the statistical mechanics, for conserved number of phase points, was achieved in [Vamoş,, 2007]. In this article we consider a general kinematic description for systems of particles that can be created and destroyed, with piecewise analytical trajectories and discontinuous velocities at a finite number of points. Under these conditions, we prove in A the following properties of the CGST averages over -dimensional cubes and symmetric time intervals.
If a discrete system of particles is described by piecewise analytic time functions , , then
1) there exists a macroscopic description of the same system given by almost everywhere (a.e.) continuous fields through coarse-grained space-time averages
| (1) |
where , are the components of the -th particle trajectory, is the half length of the temporal averaging interval, is the volume of the open -dimensional cube , and is the characteristic function of the interval ,
2) has continuous partial derivatives a.e. in and satisfies the identity
| (2) |
where are the velocity components of the -th particle and accounts for discontinuous variations produced when a particle is created or consumed in chemical reactions or by finite jumps of the function .
For , , the CGST average (1) counts the number of particles inside the cube during a time interval of length , that is, is an a.e. continuous approximation of the macroscopic concentration field. The average over the number of particles defined by , if , and by , if provides an a.e. continuous approximation of the macroscopic velocity field [Vamoş et al.,, 1996, 2000]. In particular, if the particles move with the constant velocity , according to (1), . In the absence of chemical reactions and jump discontinuities the term in (2) vanishes and one obtains a continuity equation,
| (3) |
For the CGST average (1) with gives the estimation of the concentration by the usual volume averaging formula. The essential advantage of (1) is that the additional time average yields a.e. continuous fields obeying the identity (2), which provides a frame to close the balance equations [Vamoş et al.,, 1997, 2000].
In the framework of the statistical mechanical theory of transport processes [Irving and Kirkwood,, 1950], the continuous concentration field at the scale of the mathematical continuum, hereafter called “fine-grained concentration”, is defined as an average over the ensemble of realizations of the transport process,
where is the Dirac function and denotes the realization of the random trajectory. Applying the averaging operator to (1), for , with , and expressing the characteristic function of the cube in (1) with the aid of the Dirac functional
one obtains the following result.
The ensemble average of the coarse-grained average is an average of the fine-grained concentration over the cube and the time interval given by
| (4) |
The ensemble average defines the continuous concentration field as observed at the spatio-temporal scale . Equation (4) is a particular case of the general relation between the smooth continuous field and the CGST average of its microscopic description [Suciu,, 2001, Eq. (4.6)]. For , Eq. (4) gives the relation between the “integrating continuous fields” and “counting particles” averaging procedures in sampling volume approaches.
The use of CGST averages (1) in numerical simulations is conditioned by the piecewise analyticity of . Random walks on lattices are eligible because the corresponding trajectories and velocities are piecewise analytic functions with numerable discontinuity points at the jump instants [Vamoş et al.,, 2000]. In GRW simulations, the sum over the number of particles in (1) is equivalent to summing up the contributions of the groups of particles jumping between the same lattice sites in the interior of the cube , in the time interval .
3 Verification of the CGST averaging procedure
The goal of the space-time upscaling will be achieved by performing CGST averages on microscopic descriptions consisting of simulations of transport in porous media performed with GRW algorithms. In this section, we consider the one-dimensional case and we verify the reliability of the averaging procedure applied to simulations of diffusion with both the unbiased GRW and its biased version, BGRW.
3.1 Implications of the CGST upscaling
In the one-dimensional case, the CGST average (1) becomes
| (5) |
and the continuity equation (3) takes the form
| (6) |
Considering and using (2), the advective flux in (6) can be expressed as
Further, by assuming and considering the average of particle positions in the averaging domain and the continuity equation (6), we get
and the continuity equation can be reformulated as a Fokker-Planck equation,
| (7) |
The positivity of the coefficient in (7) is a “microscopic criterion of irreversibility” for the thermodynamic system of the particles [Suciu,, 2001]. However, the drift coefficient differs from the Eulerian drift and Eq. (7) cannot be generally identified with the advection-diffusion equation valid at the macroscopic scale. Instead, assuming the thermodynamic equilibrium of the system of particles, , and , which implies according to (6), Eq. (7) reduces to
| (8) |
Equation (8) is a stationary diffusion equation with diffusion coefficient , which under the assumption of thermodynamic equilibrium must be constant. Hence, the reformulation of the continuity equation and the assumption of thermodynamic equilibrium highlight the self-diffusion process with “intrinsic diffusion coefficient” of the system of particles of the microscopic description.
The relation defining the intrinsic diffusion coefficient , as well as the average defining the macroscopic velocity will be used in the following to verify the numerical approach for computing CGST averages over microscopic descriptions consisting of systems of random walkers.
3.2 GRW/BGRW algorithms
The GRW algorithms can be understood as weak schemes for Itô stochastic differential equations [Suciu,, 2019]. In the above one-dimensional case, a weak scheme for solving the equation , where is the standard Wiener process, can be obtained by using the discrete random walk process with increments consisting of jumps over steps on a regular lattice. The integer number is the amplitude of the diffusive displacements, is the truncated advective displacement, is a random variable taking three discrete values with probabilities , , and the real parameter is the dimensionless diffusion coefficient. The probability density of the Itô process , i.e. the normalized concentration of random walkers solving the Fokker-Planck equation , is approximated by counting the number of random walkers at lattice sites , , where is the total number of random walkers. As in Section 2 above, by we denote the fine-grained concentration.
The unbiased GRW algorithm distributes the random walkers over lattice sites according to
| (9) |
where the numbers of random walkers are binomial random variables with statistics specified by the parameter . They represent the number of particles which at time undergo jumps from a lattice site to , , and , respectively.
An alternative weak scheme for the above Itô equation uses the random walk process with increments and biased jump probabilities , . This results in a biased algorithm, BGRW, which distributes the random walkers on first-neighbor lattice sites according to
| (10) |
The restriction implies an upper bound for the local Péclet number, , which imposes smaller and , rendering the BGRW algorithm slower than the unbiased GRW algorithm.
For a general presentation of the GRW/BGRW algorithms we refer to [Suciu,, 2019, Chap. 3]. Implementation details, for more complex problems consisting of one-component reactive transport fully coupled to saturated/unsaturated flows governed by the degenerate Richards equation can be found in [Suciu et al.,, 2021, Sect. 4.2], and for transport with multi-species Monod reactions in [Suciu and Radu,, 2022, Sect. 3].
3.3 Averaging procedure and verification
The CGST average (5) on the GRW/BGRW simulations is computed by summing up contributions from groups of random walkers as follows. Let be the number of lattice sites inside the open interval . If the conditions and are fulfilled at every occupied site, the CGST average of the microscopic quantity is computed by
| (11) |
where are contributions of the quantity to the CGST average.
As microscopic quantities we consider in the following , for the computation of the CGST concentration , , for the mean particle positions , and , for the mean velocity . The computation of the intrinsic diffusion coefficient defined during the derivation of the stationary diffusion equation (8) will be also used in the following to verify the correctness of the averaging procedure. Since is a property of the thermodynamic system, it does not depend on the flow regime and can be computed as well for microscopic descriptions consisting of GRW simulations of advection-diffusion processes. To do that, we have to consider the velocity of the random walk jumps. In the case of the microscopic description provided by the unbiased GRW algorithm, computed by disregarding the advective displacement is associated to the middle of the jump interval and is computed for the microscopic quantity . When using the BGRW algorithm (10), where the bias of the random walk jump probabilities accounts for advection, is computed with binomial random variables representing the number of random walkers jumping on neighboring sites with unbiased probabilities , where is the same parameter as that used to compute biased jump probabilities in case of non-vanishing advection velocity , and the corresponding microscopic quantity is given by .
Using (9) and (10), the CGST averages considered in this article are computed according to (11) with the functions listed below:
-
1.
the concentration
-
2.
the mean particle positions
-
(a)
GRW algorithm:
-
(b)
BGRW algorithm:
-
(a)
-
3.
the mean velocity
-
(a)
GRW algorithm:
-
(b)
BGRW algorithm:
-
(a)
-
4.
the product position-velocity
-
(a)
GRW algorithm:
-
(b)
BGRW algorithm:
-
(a)
The averaging procedure is verified by computing the flow velocity and the intrinsic diffusion coefficient with the expressions derived by CGST averaging in Section 3.1. We shall consider the fine scale transport process described by the advection-diffusion equation with constant coefficients and ,
| (12) |
The fine-grained concentration solving (12) is approximated numerically with biased and unbiased GRW algorithms, which also provide microscopic descriptions of the physical system. As follows from Eq. (5), in this case the macroscopic flow velocity equals the constant drift . Also, one expects that the intrinsic diffusion coefficient equals the diffusion parameter of the advection-diffusion process.
For illustration and verification purposes, we consider the one-dimensional spatial domain , a time interval of length , and GRW/BGRW lattices of constant and sites, denoted by . We impose no-flux conditions and which ensure a steady-state solution of Eq. (12). The initial condition consists of random walkers uniformly distributed on the lattice, that is, a constant concentration mole per lattice site. Under these conditions, according to (11), one obtains the normalized CGST average concentration , which does not depend on and equals the spatial average over the interval . With and , the CGST averages are computed over 9 disjoint spatial intervals of length and three time intervals of length centered at the sampling times 0.1, 0.5, and 0.9. The lattice constant is progressively decreased from to and the corresponding time steps are obtained from the condition , with in case of BGRW algorithm, and with both and in case of unbiased GRW (See Section 3.2). The constant velocity is set to and the diffusion coefficient is set to .
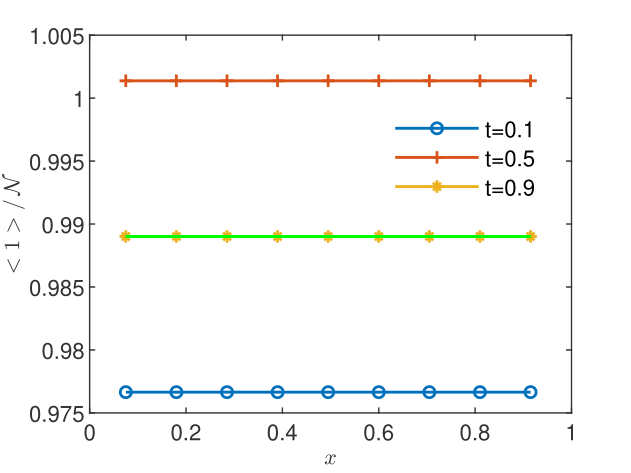
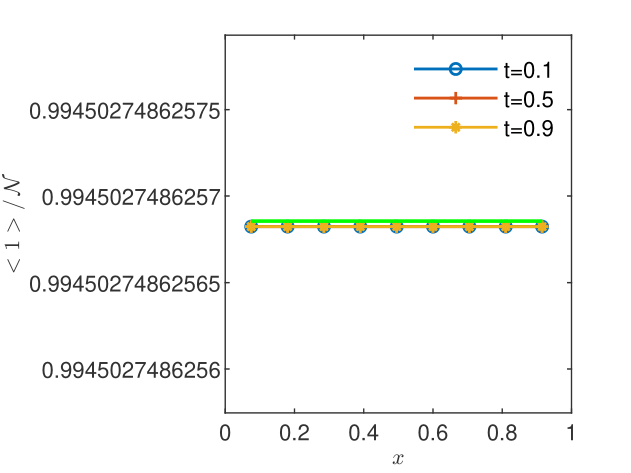
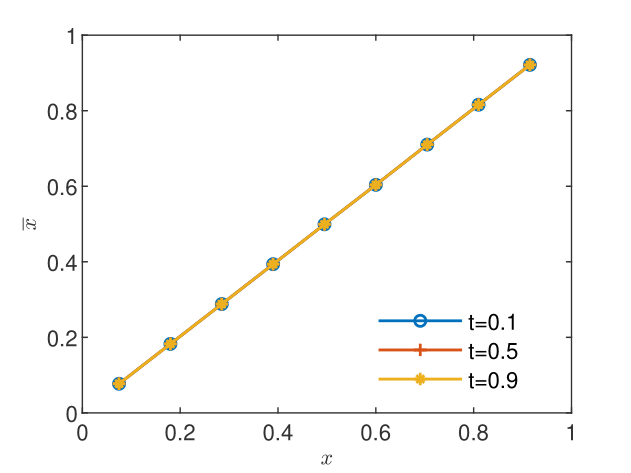
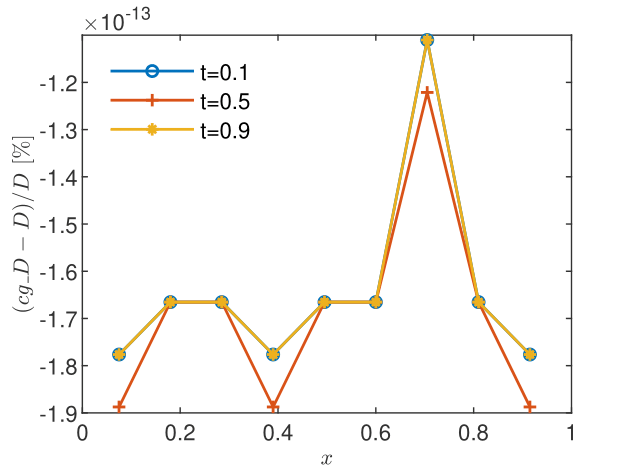
It has been found that the steady state, as indicated by a CGST concentration almost identical to that given by the spatial average, is reached for in case of the BGRW microscopic description (see Figs. 2 and 2) and for in case of the GRW description. However, as seen in Figs. 4 and 4, the mean particle positions are stationary, with , and the coarse-grained computation of the intrinsic diffusion coefficient is highly accurate, even if the coarse-grained concentration is not yet stationary. The mean diffusion coefficient , the mean velocity , and the corresponding standard deviations are calculated from sequences of and values at the points inside the spatial averaging interval averaged over the three sampling times. The results presented in Table 1 are highly accurate for both and .
| BGRW | GRW | BGRW | GRW | |
|---|---|---|---|---|
| 5.00e-03 | 0.0001 2.25e-19 | 0.0001 2.51e-19 | 1.00 0.00 | 1.00 0.00 |
| 2.50e-03 | 0.0001 5.07e-19 | 0.0001 6.21e-19 | 1.00 0.00 | 1.00 0.00 |
| 1.25e-03 | 0.0001 1.16e-18 | 0.0001 1.30e-18 | 1.00 2.36e-16 | 1.00 0.00 |
| 6.25e-04 | 0.0001 1.42e-18 | 0.0001 1.78e-18 | 1.00 2.36e-16 | 1.00 0.00 |
Since the implementation of the CGST approach with the BGRW microscopic description is simpler and free of overshooting errors in simulations of biodegradation reactions [Suciu and Radu,, 2022, Sect. 5.2], it will be used in the following to illustrate the space-time upscaling in reactive transport problems.
4 Space-time upscaling in one-dimensional reactive transport problems
We consider the one-dimensional advection-diffusion transport in saturated porous media of two reactive chemical species governed at the fine-grained scale by the coupled system of equations
| (13) |
As shown in [Destouni and Graham,, 1997], the space-time scales of the experimental measurements are determined by the observation method. The application of the CGST approach in modeling real experiments is the subject of forthcoming studies. In the following, we illustrate the CGST space-time upscaling by hypothetical experiments with independent spatial and temporal scales which ensure a good resolution of the averages and are bellow the space-time scales on which the reacting species concentrations undergo significant changes. Precisely, in the examples presented below, we choose the spatial scale as 1/30 of the length of the domain in the mean flow direction and the temporal scale as 1/11 of the total observation time.
The discrepancy between volume and CGST averages, and , at a given time point is quantified by relative errors computed with vector -norms as , as well as by maximum relative differences
The influence of and on discrepancy is analyzed for a specific problem in B.
4.1 Bimolecular reaction with conservation of the total mass
Let us begin by considering a simple reaction where the first species is consumed and the second species is augmented at the same rate. The corresponding reaction rates are given by and , with constant . Summing up the two equations (13) one obtains an advection-diffusion equation for the passive transport of the sum , that is, the total mass is conserved.
Similarly to the derivation of Eq. (3), we find that the CGST averages of the two molecular species satisfy the particular form of Eq. (2),
| (14) |
where we use the notation to specify the molecular species when integrating particle trajectories in Eq. (5) to compute the CGST average concentrations. According to (1), the terms account for creation and consumption of particles, hence, they can be interpreted as space-time upscaled reaction terms. We remark that while the fine-grained concentrations are governed by the advection-diffusion-reaction equations (13), the balance equations (14) verified by the CGST concentrations have the general form of an advection-reaction equation.
For consistency reasons, the conservation of the sum of the fine-grained concentrations should imply the conservation of the upscaled concentrations. The latter implies and the passive transport of the sum . To verify this statement, we compute CGST averages on the BGRW description associated to Eqs. (13), with constant parameters , , and . The two molecular species are represented, as in Section 3.3 above, by one mole of particles uniformly distributed on the one-dimensional lattice at the initial time. As boundary conditions we fix the concentration on to its initial value and set the no flux condition on the outflow boundary on . We use the domain , total time , spatial scale , and temporal scale . The reactive transport is solved by a splitting scheme which alternates BGRW transport steps with reaction steps computed deterministically (a one-dimensional version of the two-dimensional splitting approach proposed in [Suciu and Radu,, 2022, Sect., 3.1]). The computations are carried out with and .
Since the concentration is not vanishing in the domain during the computation, the intrinsic diffusion coefficient and the velocity can be calculated as in Section 3 above. One obtains accurate estimates and , which certifies the correctness of the CGST averaging procedure. In Figs. 6 and 6, the normalized CGST averages are compared to the spatial averages computed, similarly to (11), by , at the center of the temporal interval. One remarks that the conservation of the sum of the two upscaled species concentrations is verified with high accuracy. As shown in Table 2, the volume and the CGST averages are practically indistinguishable, with relative differences of the order of . Hence, for small temporal variations of the concentration, as in the example presented here, the volume average alone is an appropriate model of the experimental measurements.
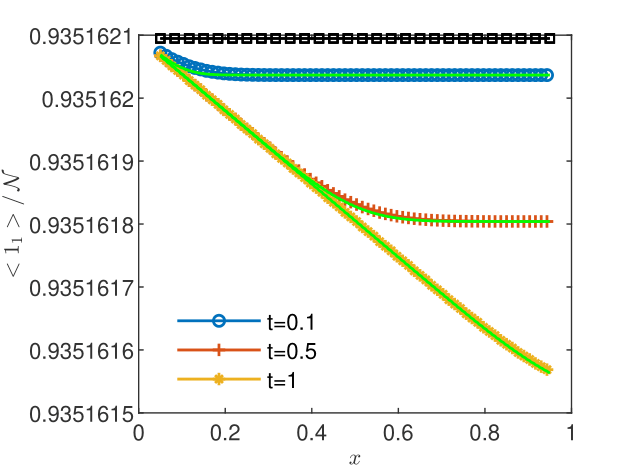
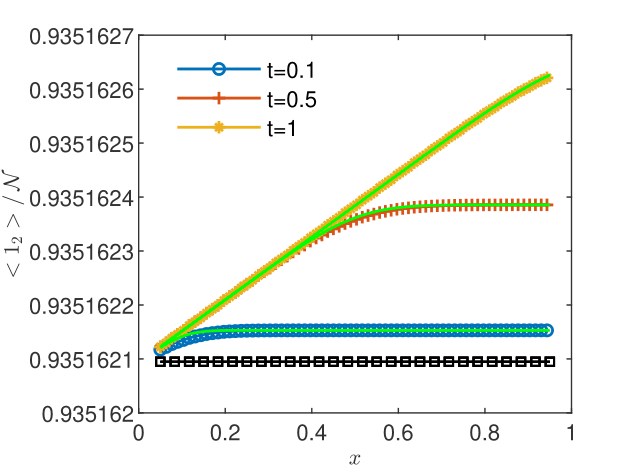
| 0.1 | 2.44e-09 | 7.54e-09 | 2.44e-09 | 7.54e-09 |
|---|---|---|---|---|
| 0.5 | 1.81e-09 | 3.99e-09 | 1.81e-09 | 3.99e-09 |
| 1 | 7.54e-10 | 2.53e-09 | 7.54e-10 | 2.53e-09 |
4.2 Reactive transport with Monod reactions
In the following, we apply the CGST upscaling procedure to aerobic biodegradation processes in the subsurface [Wiedemeier et al.,, 1999]. An electron donor contaminant (e.g., benzene) of concentration is consumed by the biomass contained in the aqueous system, hereafter assumed constant in time and uniformly distributed in with , in the presence of an electron acceptor (oxygen) of concentration . The electron donor and acceptor are consumed at rates and , where is the volumetric water content, and are stoichiometric constants, and
| (15) |
is a Monod term with parameters and . For the purpose of the present illustration of the CGST procedure, we consider the example used in [Bause and Knabner,, 2004, Brunner et al.,, 2012] and we set the parameters of the reaction system to , , , constant for saturated flow, and variable for partially saturated soils.
4.2.1 Monod reactions in saturated flow regime
The one-dimensional biodegradation problem presented below is formulated with the same constant transport parameters and , computational domain , final time , spatial and temporal scales and , and is solved with the same numerical scheme as in the previous section. The initial contaminant concentration is set to one mole uniformly distributed on the lattice sites , with , , and zero otherwise. Complementary, the oxygen concentration is set to one mole uniformly distributed on the lattice sites , and zero otherwise. The condition is imposed on the outflow boundary and the first sites are set to the initial condition after each time step . One simulates in this way a constant injection of contaminant near the inflow boundary, the consumption of the contaminant and oxygen through the biodegradation process in , and the evacuation of the mixture of contaminant and oxygen at the outflow boundary. This is a simplified one-dimensional version of the two-dimensional biodegradation problem for saturated aquifers presented in [Suciu and Radu,, 2022, Sect. 5.2].
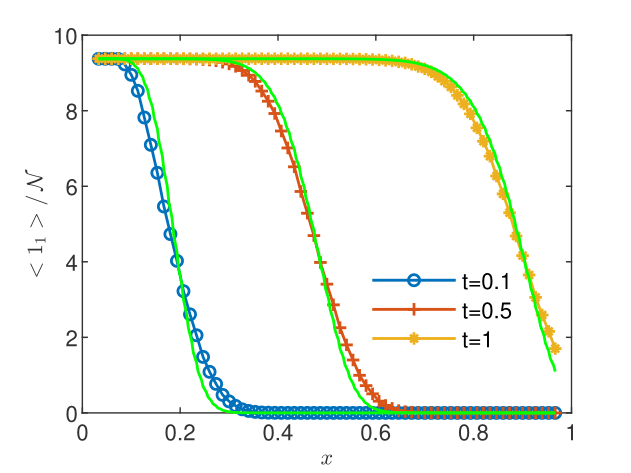
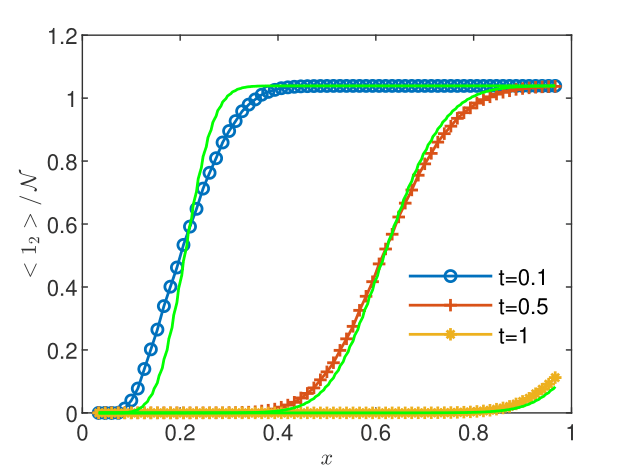
The coarse-grained averages are compared to the volume averages in Figs. 8 and 8. Differences between the two averages are visible mainly at the first sampling time. The two averages are close to each other in regions without reactions between contaminant and oxygen, e.g., contaminant concentration for at (Fig. 8) and oxygen concentration for at (Fig. 8). A more precise evaluation of the discrepancy is obtained by computing relative differences. Table 3 shows that while the global differences , computed with -norms are, with a single exception, smaller than 10%, the maximum relative differences are overall larger, with values between 17% and 57%. Similar results are obtained in one- and two-dimensional simulations of the biodegradation in heterogeneous aquifers presented in the extended version of this study [Suciu et al., 2023b, ]. Thus, even though the flow velocity and the dispersion coefficient are constant, time-dependent reactions make the transport process nonstationary and the volume average alone could be an inaccurate model of the measurement.
| 2 | 0.0992 | 0.1753 | 0.0634 | 0.5716 |
|---|---|---|---|---|
| 4 | 0.0367 | 0.4012 | 0.0400 | 0.2435 |
| 6 | 0.0199 | 0.3572 | 0.3330 | 0.2574 |
4.2.2 Monod reactions in variably saturated soils
One expects that for time-dependent reactions in non stationary flow regimes the discrepancy between volume and CGST averages will be even more pronounced. As an example, we consider a one-dimensional model problem for biodegradation processes in soil columns. The water flow in variably saturated porous media is described by the one-dimensional Richards equation
| (16) |
where is the pressure head expressed in length units, is the volumetric water content, stands for the hydraulic conductivity of the medium, and is the height oriented positively upward. The water flux given by Darcy’s law is . The reactive transport is now governed by Richards equation (16) coupled with the transport equations
| (17) |
We consider in the following the relationships defining the water content and the hydraulic conductivity given by the van Genuchten-Mualem model
| (18) |
| (19) |
where is the normalized water content, and are the residual and the saturated water content, is the hydraulic conductivity of the saturated soil, and , , are model parameters depending on the soil type. In this example, we consider the parameters of a silt loam used in previously published studies [List and Radu,, 2016, Illiano et al.,, 2020, Suciu et al.,, 2021, Suciu and Radu,, 2022], , , , , . The soil heterogeneity is modeled by a fixed realization of a random saturated hydraulic conductivity with mean equal to the parameter of the loam soil model. The realization is computed with the Kraichnan method described in [Suciu,, 2019, Appendix C.3.1.2], for a random field with Gaussian correlation specified by the correlation length and the variance . The dispersion is parameterized by the constant coefficient . The system of coupled equations (16-17), parameterized by the model (18-19), with reactions governed by the Monod model (15) using the same parameters as in the saturated case presented above, is solved in the domain for the final time . The space-time scale of the CGST procedure is specified by and .
The infiltration of the contaminated water in the column is driven by the variable pressure on the top boundary given by and , with . The initial pressure corresponds to the unsaturated profile and the constant pressure condition is set on the bottom boundary. The initial contaminant concentration is set to one mole uniformly distributed on the lattice sites , with , , on the top of the domain and zero otherwise. The oxygen concentration is set to one mole uniformly distributed on the lattice sites and zero otherwise. The top sites are set to the initial condition after each time step and the condition is imposed on the bottom boundary for both species. With these, one simulates a continuous injection of contaminant over a length on the top of the column, assuming that the incoming contaminated water does not contain oxygen, in conditions of free drainage at the bottom of the column.
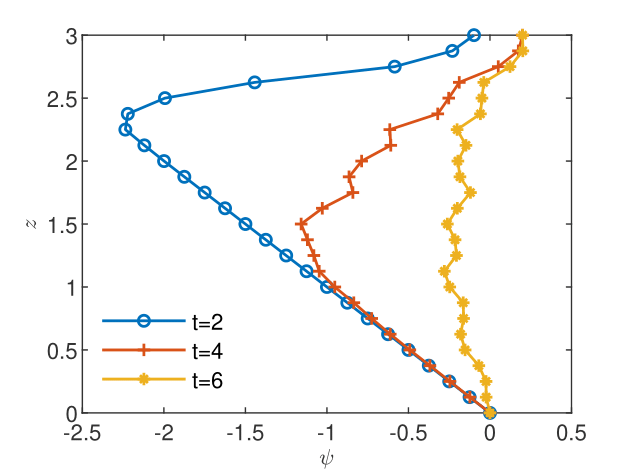
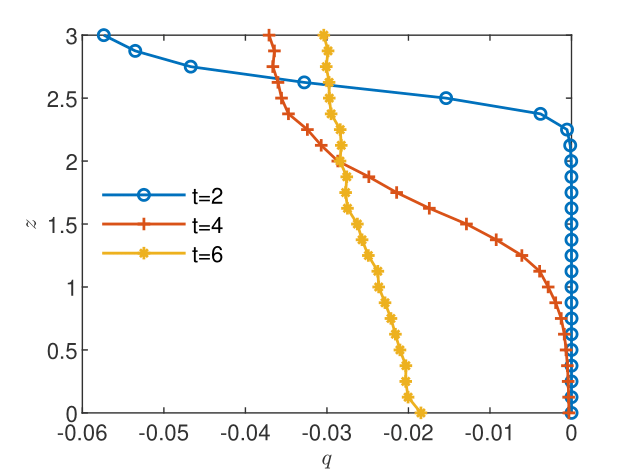
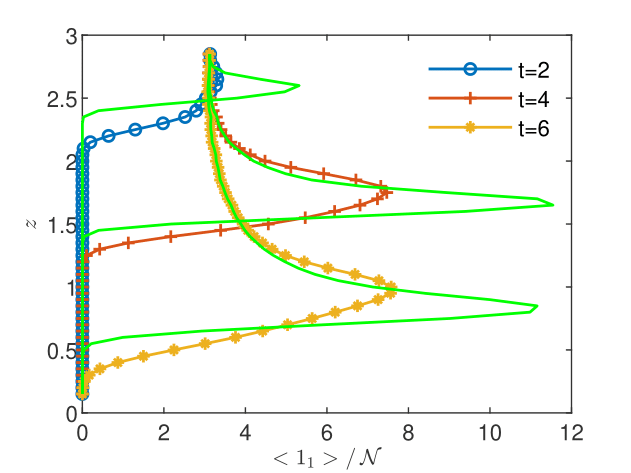
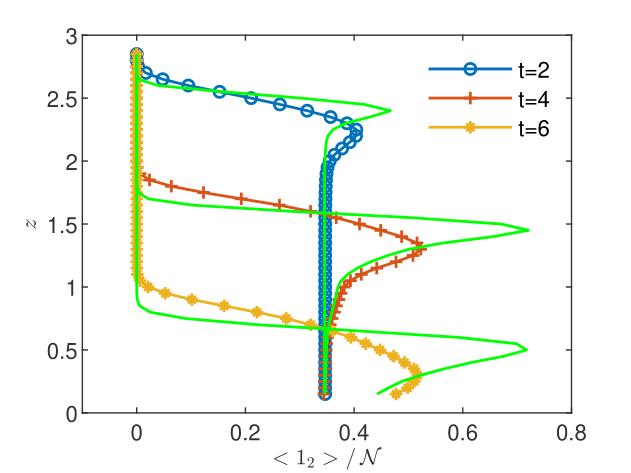
The flow equation (16) is solved with the iterative GRW algorithm for one-dimensional flows, implemented as an -scheme linearization approach (see [Pop et al.,, 2004, List and Radu,, 2016]) capable to handle the nonlinearity and the degeneracy of the Richards equation [Suciu et al.,, 2021, Sect. 2]. At each time step , the solution of the Richards equation is transmitted to the reactive transport solver. The latter is an iterative -scheme, which at each iteration step solves the system (17) with an operator splitting procedure consisting of a BGRW solution of the advection-diffusion process and a deterministic solution of the reaction step (this is the one-dimensional version of the two-dimensional iterative scheme introduced in [Suciu and Radu,, 2022, Sect. 3.2]). The spatial step is fixed to . The time steps, determined as the minimum of the time steps required by the GRW flow solver and the BGRW transport solver lay between and . The number of iterations required for the convergence of the two -schemes ranges between 100 and 450.
The flow solutions and the space-time upscaled concentrations are presented in Figs. 10-12. The pressure profiles recorded at the three sampling times shown in Fig. 10 capture the spatial heterogeneity of the flow solution and the transition from the unsaturated regime () to the saturated regime (). The resulting flow velocity (Fig. 10) is strongly variable in both space and time. The complexity of the unsaturated/saturated flow impacts on the distribution of the reacting species (see Figs. 12 and 12), which inherits the heterogeneity and the spatio-temporal variability of the flow. In these conditions, the discrepancy between the volume and the CGST average is dramatically large at all the tree sampling times, with maximum relative differences between 59% and 99% (Table 4). Thus, averaging over the spatial interval at given time is completely irrelevant for the observation/measurement made at the spatio-temporal scale centered at . Excepting special situations, such as the case of almost homogeneous reactions with slow time variations presented in Figs. 6 and 6, the time average has to be considered as well in one-dimensional modeling of experimental observations.
| 2 | 0.5054 | 0.9895 | 0.1127 | 0.5867 |
|---|---|---|---|---|
| 4 | 0.3420 | 0.6950 | 0.2392 | 0.6057 |
| 6 | 0.3136 | 0.7702 | 0.3745 | 0.6576 |
5 CGST averaging in two-dimensional transport problems
The two-dimensional model for reactive transport with biodegradation reactions, similar to the one-dimensional model considered above, is governed by the equations
| (20) | |||
| (21) |
Equations (20-21) are parameterized with the van Genuchten-Mualem model (18-19) and the same Monod reaction system as in the previous sections. The two-dimensional CGST averaging procedure, first verified by computing the velocity components and the diffusion coefficients, will be used in the following to compute space-time upscaled concentrations.
5.1 Verification of the two dimensional CGST averaging procedure
The two-dimensional CGST averaging procedure corresponds to in the general definition (1). Similarly to the derivation of the one-dimensional stationary diffusion equation (8) given in Section 3, one obtains the diffusion equation
with diffusion tensor defined by . The numerical implementation of the CGST averaging procedure is a straightforward extension of that used in the one-dimensional case.
We perform BGRW/GRW simulations in the two-dimensional domain of the advection-diffusion process defined by constant diagonal diffusion tensor with components and constant velocity . The BGRW/GRW simulations are done with the same number of particles and space-time discretization and the CGST averages are computed with the same parameters and as in the one dimensional case. The components of the diffusion tensor (Tables 5 and 6) and of the velocity (Table 7) computed with the CGST procedure are, again, in very good agreement with the nominal coefficients of the advection-diffusion process.
| 5.00e-03 | 0.0001 1.59e-19 | -1.59e-20 8.13e-20 | 0.00 0.00 | 0.0001 0.00 |
|---|---|---|---|---|
| 2.50e-03 | 0.0001 1.31e-19 | -1.06e-19 2.92e-19 | 0.00 0.00 | 0.0001 0.00 |
| 1.25e-03 | 0.0001 3.02e-19 | 5.93e-20 2.36e-19 | 0.00 0.00 | 0.0001 2.87e-20 |
| 6.25e-04 | 0.0001 7.47e-19 | 1.23e-19 3.02e-19 | 0.00 0.00 | 0.0001 1.44e-20 |
| 5.00e-03 | 0.0001 1.20e-19 | -3.57e-21 7.29e-20 | 0.00 0.00 | 0.0001 1.44e-20 |
|---|---|---|---|---|
| 2.50e-03 | 0.0001 1.63e-19 | -5.21e-20 2.63e-19 | 0.00 0.00 | 0.0001 2.87e-20 |
| 1.25e-03 | 0.0001 2.46e-19 | -1.09e-19 2.73e-19 | 0.00 0.00 | 0.0001 1.44e-20 |
| 6.25e-04 | 0.0001 9.66e-19 | 2.07e-19 3.56e-19 | 0.00 0.00 | 0.0001 1.44e-20 |
| BGRW | GRW | BGRW | GRW | |
|---|---|---|---|---|
| 5.00e-03 | 1.00 0.00 | 1.00 0.00 | -2.71e-19 0.00 | 0.00 0.00 |
| 2.50e-03 | 1.00 1.18e-16 | 1.00 0.00 | -1.39e-19 0.00 | 0.00 0.00 |
| 1.25e-03 | 1.00 0.00 | 1.00 0.00 | 1.14e-19 2.55e-35 | 0.00 0.00 |
| 6.25e-04 | 1.00 2.36e-16 | 1.00 0.00 | -9.55e-20 1.28e-35 | 0.00 0.00 |
5.2 Application to reactive transport in variably saturated soils
To illustrate the two-dimensional CGST averaging procedure, we simulate the same biodegradation process as in the one-dimensional case in the domain . We consider the same soil model, vertical profile of the pressure, the same top and bottom pressure boundary conditions, and no-flow conditions on the left and right boundaries. The initial concentrations for contaminant and oxygen in the rectangle and in the surrounding region take the same values as on the top sites and on the remaining sites of the lattice in the one-dimensional problem and concentrations in are set to the initial condition after each time step. No-flux conditions are imposed on the bottom and left/right side boundaries for both the contaminant and the oxygen concentrations. CGST averages are computed with and , for a total simulation time . The flow and the BGRW solutions are computed with the flow -scheme from [Suciu et al.,, 2021, Sect. 4.1] coupled to the iterative splitting procedure introduced in [Suciu and Radu,, 2022, Sect. 3.2].

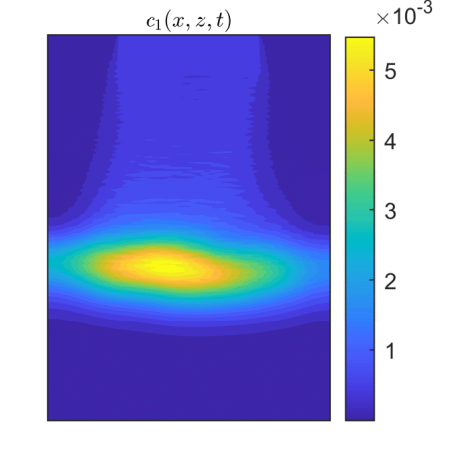
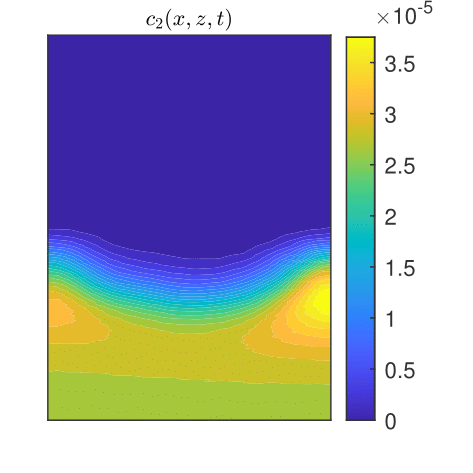
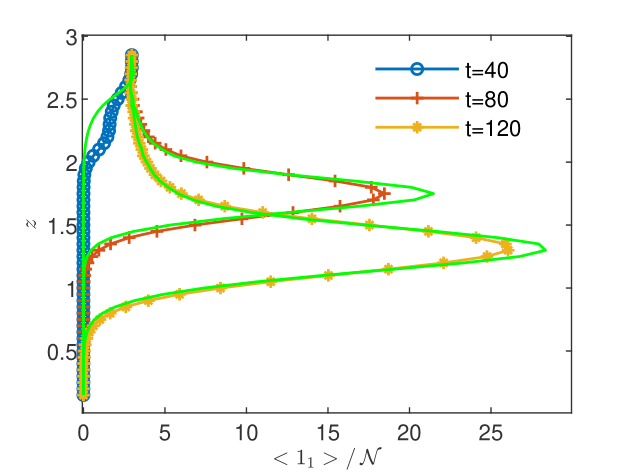
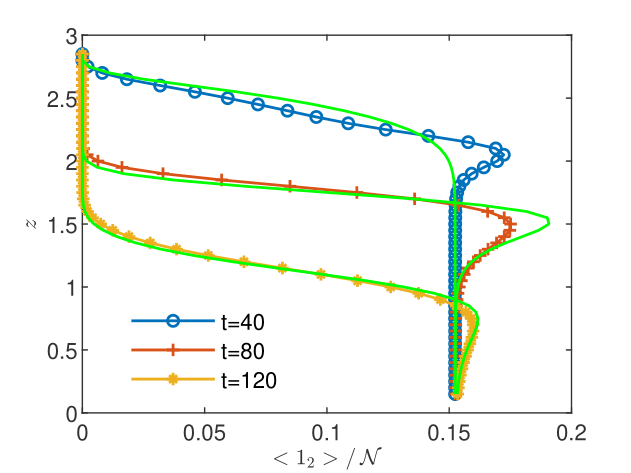
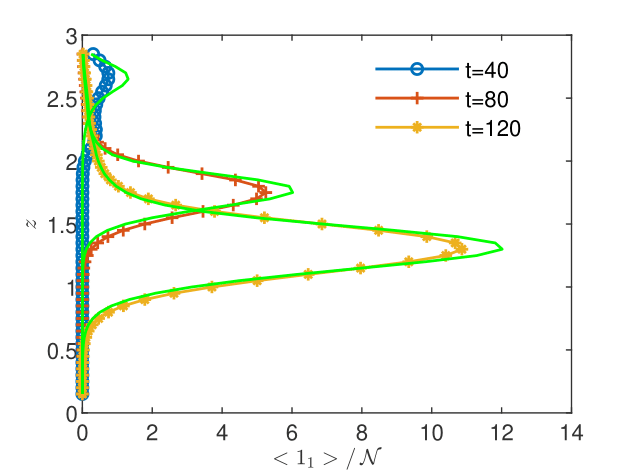
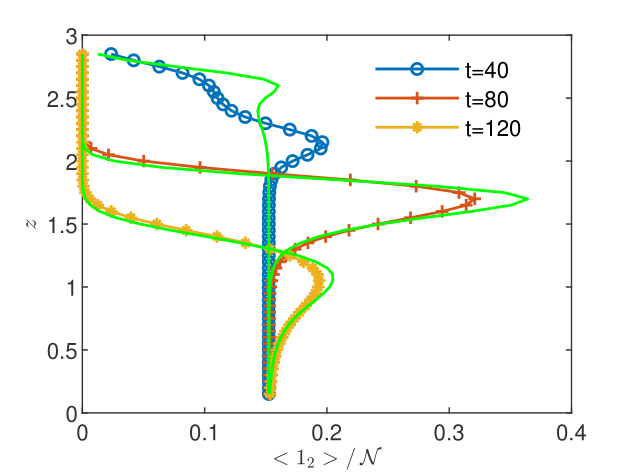
CGST averages are computed along a vertical sampling line placed at the center of the horizontal edge, as well as along a vertical line close to the right boundary of the domain. Figures 13 - 15 show the flow solution and the fine-grained contaminant and oxygen concentrations at the final time . Significant differences between the CGST and volume averages at the three sampling times can be observed for both contaminant and oxygen concentrations presented in Figs. 17-19 in regions where the two species interact and negligible differences outside the reaction zone (indicated by constant concentrations). One remarks also that in case of decentered sampling, near the right boundary (Figs. 19 and 19), these differences are generally larger than for centered sampling line (Figs. 17 and 17). Table 8 quantifies these visual observations and warns that disregarding the time average when modeling measurements through two-dimensional simulations of reactive transport in partially saturated soils may result in discrepancies up to 80% with respect to the CGST averaging approach.
| centered | decentered | |||||||
|---|---|---|---|---|---|---|---|---|
| 40 | 0.3466 | 0.8041 | 0.0675 | 0.1389 | 0.6080 | 0.7670 | 0.1320 | 0.5471 |
| 80 | 0.1198 | 0.1636 | 0.0536 | 0.3479 | 0.1426 | 0.1737 | 0.0776 | 0.1354 |
| 120 | 0.0654 | 0.0880 | 0.0280 | 0.0462 | 0.0862 | 0.1062 | 0.0440 | 0.2204 |
6 Summary
The CGST-GRW approach proposed in this article performs the space-time upscaling adapted to the spatio-temporal scale of a hypothetical measurement. The CGST averages over symmetrical volumes and time intervals of the microscopic description of a corpuscular system given by piecewise analytic time functions are a.e. continuous fields which verify identities similar to the local balance equations of the fluid dynamics. If the averages correspond to upscaled concentrations, these identities allow us to derive theoretical expressions for the flow velocity and the intrinsic diffusion coefficients of the system of particles. The microscopic description of reactive transport in porous media consists of GRW simulations of the advective-diffusive movement of the actual number of molecules involved in reactions. The chemical reactions are modeled deterministically by solving the reaction system with concentrations expressed as mole fractions of the number of reacting molecules. The main results of this study are summarized as follows.
-
1.
The codes for the CGST-GRW numerical modeling are verified by computing the theoretical expressions for flow velocity and intrinsic diffusion coefficients and one finds an excellent agreement with the nominal values of these input parameters.
-
2.
If the reacting system consists of biomolecular reactions in a uniform flow, the initial distribution of the reacting species is uniform, and the boundary conditions force constant concentration solutions, the CGST average is practically indistinguishable from the classical volume average.
-
3.
For biodegradation reactions in saturated flows, the CGST averages may significantly differ from the volume averages even if the flow is stationary, due to the time-dependence of the reaction process.
-
4.
The discrepancy between volume and CGST averages may be dramatically increased if the biodegradation process takes place in partially saturated soils with time-dependent flow velocity.
-
5.
According to (4), the CGST average concentration is equivalent to a space-time average over the continuous field of the fine-grained concentration. This renders possible comparisons with time averages of classical volume sampling solutions obtained by integrating continuous fields or with time averages over solutions provided by homogenization methods. Kernel density estimates of concentrations in particle tracking simulations averaged over symmetrical time intervals can be compared as well with CGST averages computed with the same spatial and temporal scales.
Appendix A CGST averaging on -dimensional cubes
We consider the evolution of a system of particles during the time interval . Let , , , be the interval of existence of each particle, where and are the birth and dead times, respectively. These time points could be, for instance, those of generation and consumption of a molecule in chemical reactions. A kinematic microscopic description of a physical system can be achieved by arbitrary time functions , with , . Particular cases of functions are the components of the particle’s trajectory, , and the corresponding velocity components, , . The existence intervals may contain finite number of points consisting of sets of zero Lebesgue measure where the functions undergo discontinuous variations. For instance, this is the case of velocity changes at successive time steps in random walk simulations. The restrictions of to intervals are assumed to be analytic functions. So, we consider a kinematic description given by sets of piecewise analytic functions associated to the system of particles.
Let be an open -dimensional cube with side , centered at . Similarly to the approach for coarse-grained averaging over phase points describing ensembles in statistical mechanics, for the case , presented in [Vamoş,, 2007, Chap. 5], we define the CGST average over the cube and the time interval , ,
| (22) |
where is the characteristic function of the interval .
A particle enters (leaves) the cube at time instants which solve the system of equations
| (23) |
We denote by and the sets of time points corresponding to instances at which the -th particles enters or leaves the cube . It follows that, for a fixed , the integrand in Eq. (22),
| (24) |
is a continuous time function in , except at a finite number of points where it has finite jump discontinuities. Hence, is a function with bounded variation and Riemann integrable.
Using Eq. (22) and Eq. (24), the time derivative of the CGST average can be expressed as
| (25) |
The continuity of the time derivative (25) is determined by that of the function . According to (24), is not continuous when is discontinuous and is nonvanishing or, conversely, is discontinuous and is nonvanishing. The first situation occurs if the particle is created or consumed at or undergoes discontinuous variations at times inside the cube . The second situation occurs during the time intervals when the particle lies on the surface of the cube, . Taking into account the time arguments of in (25), is discontinuous on the set , where
Since has zero Lebesgue measure in , the time derivative is a.e. continuous.
As a function with bounded variation, may be decomposed as a sum of a continuous function and a jump function, . Accordingly,
| (26) |
Since, except at discontinuity points, is an analytic function, according to the fundamental theorem of Lebesgue integral calculus, the continuous part is absolutely continuous. Hence,
| (27) |
The second term of Eq. (26) consists of positive contributions when particles enter into the cube and negative contributions when they leave the cube, as well as contributions of other three types of discontinuities, which will be described below. According to Eq. (22), can be written as
| (28) |
where and . The term accounts for generation/consumption of molecules in chemical reactions. It stems from variations of when the molecule is generated/consumed in the interior of during the interval :
where and are the characteristic functions of the cube and of the time-averaging interval, respectively. Hence,
The term describes variations due to the discontinuities of at points from [Vamoş et al.,, 1997, 2000]. This is, for instance, the case if in random walk simulations when the velocity undergoes finite jumps at the end of each time step. In general,
where and are the limits from the left and from the right respectively. The term cancels spurious contributions which occur when the trajectory intersects an vertex or an edge of the -dimensional cube with . Since is defined on a set with zero Lebesgue measure, we assume that it is negligible. For instance in two-dimensional random walk simulations, unless in the worst case when most of the particles are located in the four corners of the square, the relative number of spurious contributions, of the order , where is the number of lattice points per side, is quite small and can be disregarded.
The CGST average defined by (22) depends on through the time points and . The derivative of (23) w.r.t. leads to . If , then is the lower integration limit of the time integral in (22) and is the upper limit. This implies the following expression of the partial space derivative,
| (29) |
As long as the particle’s velocity is defined and the implicit function theorem can be applied to define , the spatial derivative exists and is continuous. These conditions are not met on sets consisting of time intervals determined by with and sets as well as in cases where particles move on the surface of the cube and Eq. (23) is identically satisfied. A detailed analysis and the construction of the sets is rather involved [Vamoş,, 2007, Chap. 4] but, in the present context, it is not necessary. Indeed, since the surface has a null Lebesgue measure in , the union also has a null Lebesgue measure in and the spatial derivatives are a.e. continuous. The continuity of the partial derivatives and ensures the a.e. continuity of the CGST averages .
Appendix B Discrepancy between volume and CGST averages for different and .
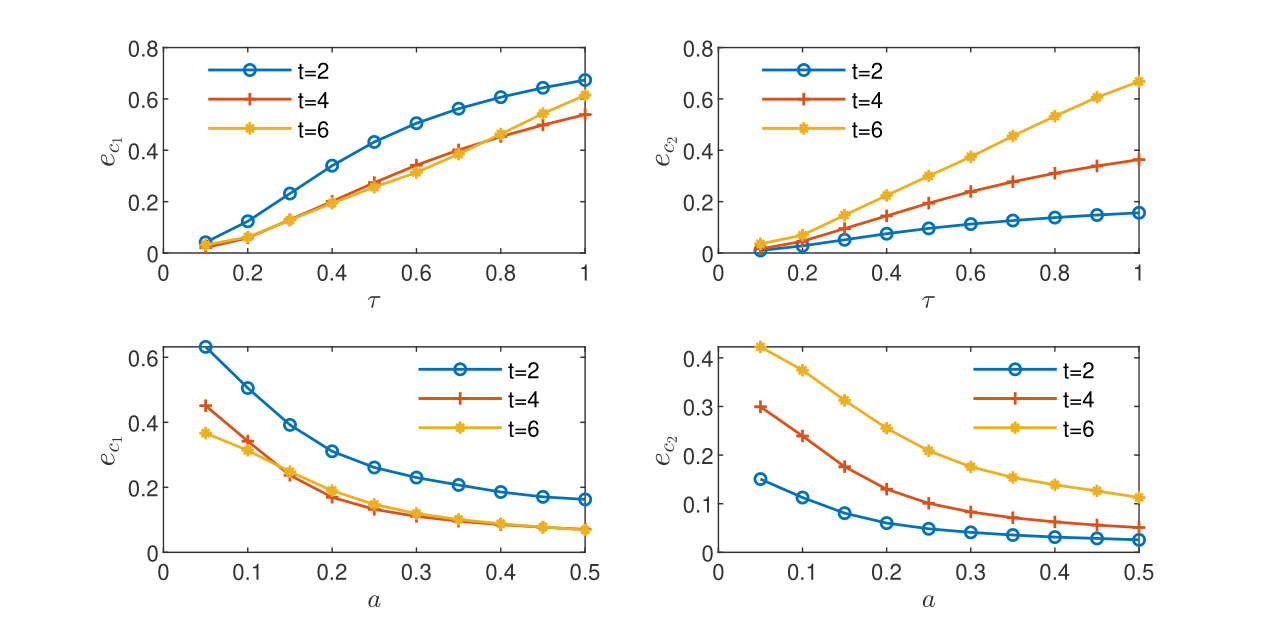
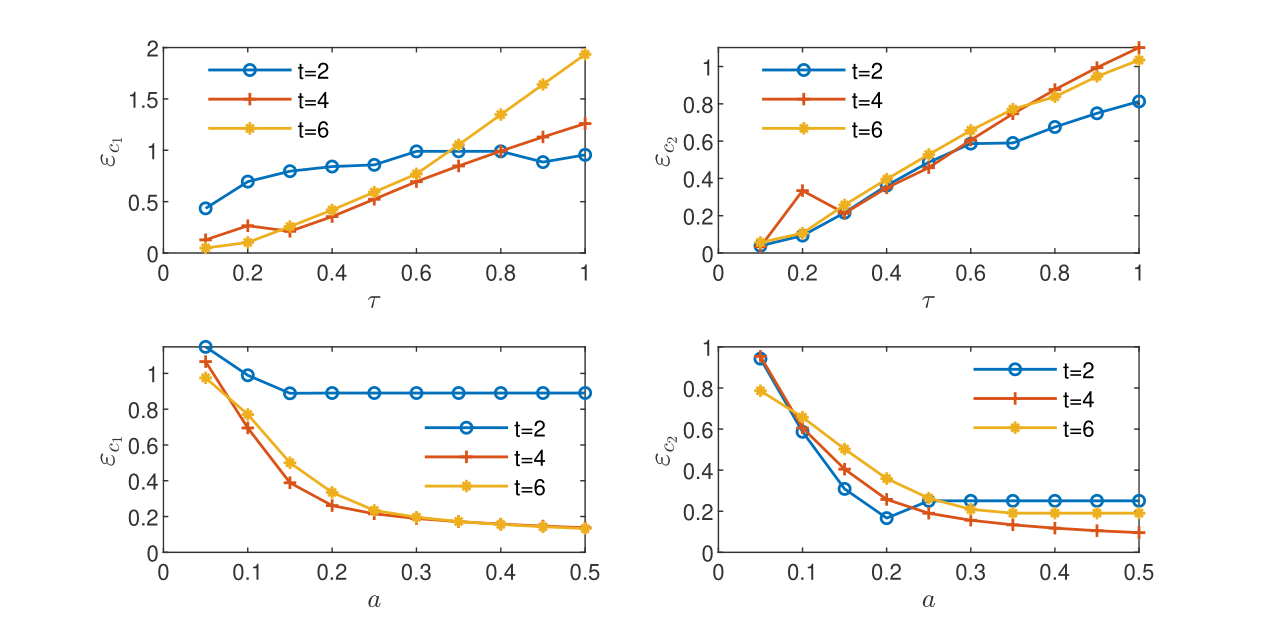
Discrepancies between the volume and CGST averages are computed for the one-dimensional example of reactive transport governed by Monod model presented in Section 4.2.2. The influence of the temporal scale and of the spatial scale on the global relative difference is illustrated in the sub-plots from Fig. 1. Similarly, the influence of and on is illustrated in Fig. 2.
Figure Fig. 1 shows a monotone increase of with for fixed and a monotone decrease with for fixed . One remarks larger values for contaminant () and smaller values for oxygen () at the first sampling time (that is, close to the contaminant source)
Figure Fig. 2 presents a rather irregular behavior of at the first sampling time. The maximum difference is less influenced by the increase of and . This is especially notable for the contaminant, with values that remain almost constant with the decrease of and the increase of .
Acknowledgements
The authors are grateful to three antonymous reviewers for their valuable comments. N. Suciu acknowledges the financial support of the Deutsche Forschungsgemeinschaft (DFG, German Research Foundation) under Grant SU 415/4-1 – 405338726 “Integrated global random walk model for reactive transport in groundwater adapted to measurement spatio-temporal scales”.
References
- Akagi and Oka, [2020] Akagi, G., Oka, T., 2020. Space-time homogenization for nonlinear diffusion. Preprint arXiv:2007.09977. https://doi.org/10.48550/arXiv.2007.09977
- Aquino and Dentz, [2017] Aquino, T., Dentz, M., 2017. Chemical continuous time random walks. Physical review letters, 119(23), 230601. https://doi.org/10.1103/PhysRevLett.119.230601
- Auriault and Adler, [1995] Auriault, J.L., Adler, P.M., 1995. Taylor dispersion in porous media: analysis by multiple scale expansions. Advances in Water Resources, 18(4), 217-226. https://doi.org/10.1016/0309-1708(95)00011-7
- Andričević, [1998] Andričević, R., 1998. Effects of local dispersion and sampling volume on the evolution of concentration fluctuations in aquifers. Water Resour. Res., 34(5), 1115–29. http://dx.doi.org/10.1029/98WR00260
- de Barros and Fiori, [2014] de Barros, F.P.J., Fiori, A., 2014. First-order based cumulative distribution function for solute concentration in heterogeneous aquifers: Theoretical analysis and implications for human health risk assessment. Water Resour. Res., 50(5), 4018–4037. http://dx.doi.org/10.1002/2013WR015024
- Bayer-Raich et al., [2004] Bayer-Raich, M., Jarsjö, J., Liedl, R., Ptak, T., Teutsch, G.2004. Average contaminant concentration and mass flow in aquifers from time-dependent pumping well data: Analytical framework. Water Resour. Res., 40(8), W08303. http://dx.doi.org/10.1029/2004WR003095
- Bause and Knabner, [2004] Bause, M., Knabner, P., 2004. Numerical simulation of contaminant biodegradation by higher order methods and adaptive time stepping. Comput. Visual. Sci., 7(2), 61–78. https://doi.org/10.1007/s00791-004-0139-y
- Bensoussan et al., [2011] Bensoussan, A., Lions, J.L. and Papanicolaou, G., 2011. Asymptotic analysis for periodic structures (Vol. 374). American Mathematical Soc.
- Berkowitz, [2021] Berkowitz, B., 2022. HESS Opinions: Chemical transport modeling in subsurface hydrological systems – Space, time, and the “holy grail” of “upscaling”. Hydrol. Earth. Syst. Sci., 26, 2161-2180. https://doi.org/10.5194/hess-26-2161-2022
- Brunner et al., [2012] Brunner, F., Radu, F.A., Bause, M., Knabner, P., 2012. Optimal order convergence of a modified BDM1 mixed finite element scheme for reactive transport in porous media. Adv. Water Resour., 35, 163–171. http://dx.doi.org/10.1016/j.advwatres.2011.10.001
- Bringedal et al., [2016] Bringedal, C., Berre, I., Pop, I. S., Radu, F. A., 2016. Upscaling of nonisothermal reactive porous media flow under dominant Péclet number: the effect of changing porosity. Multiscale Model. Simul. 14(1), 502–533. https://doi.org/10.1137/15M1022781
- Caroni and Fiorotto, [2005] Caroni, E., Fiorotto, V., 2005. Analysis of concentration as sampled in natural aquifers. Transport Porous Media, 59(1),19–45. http://dx.doi.org/10.1007/s11242-004-1119-x
- Cushman, [1983] Cushman, J.H., 1983. Multiphase transport equations: I - general equation for macroscopic statistical, local space-time homogeneity. Transport Theor. Stat. Phys., 12(1), 35–71. http://dx.doi.org/10.1080/00411458308212731
- Dabrowska and Rykala, [2021] Dabrowska, D., Rykala, W., 2021. A review of lysimeter experiments carried out on municipal landfill waste. Toxics, 9(2), 26. https://doi.org/10.3390/toxics9020026
- Destouni and Graham, [1997] Destouni, G., Graham, W., 1997. The influence of observation method on local concentration statistics in the subsurface. Water Resour .Res., 33(4),663–676. http://dx.doi.org/10.1029/96WR03955
- Fernàndez-Garcia and Sanchez-Vila, [2011] Fernàndez-Garcia, D., Sanchez-Vila, X., 2011. Optimal reconstruction of concentrations, gradients and reaction rates from particle distributions. J. Contam. Hydrol., 120, 99–114. https://doi.org/10.1016/j.jconhyd.2010.05.001
- Gray and Miller., [2013] Gray, W.G., Miller, C.T., 2013. A generalization of averaging theorems for porous medium analysis. Adv. Water Resour. 62, 227–37. https://doi.org/10.1016/j.advwatres.2013.06.006
- Gray et al., [2015] Gray, W.G., Dye, A.L., McClure, J.E., Pyrak-Nolte, L.J., Miller, C.T., 2015. On the dynamics and kinematics of two-fluid-phase flow in porous media. Water Resour. Res., 51(7), 5365-81. https://doi.org/10.1016/10.1002/2015WR016921
- He and Sykes, [1996] He, Y., Sykes, J.F., 1996. On the spatial-temporal averaging method for modeling transport in porous media. Transport Porous Media, 22(1), 1–51. https://doi.org/10.1007/BF00974310
- Heße et al., [2009] Heße, F., Radu, F.A., Thullner, M. and Attinger, S., 2009. Upscaling of the advection-diffusion-reaction equation with Monod reaction. Adv. Water Resour., 32(8), 1336–1351. https://doi.org/10.1016/j.advwatres.2009.05.009
- Hornung, [1996] Hornung, U., 1996. Homogenization and porous media (Vol. 6). Springer Science & Business Media. https://link.springer.com/book/10.1007/978-1-4612-1920-0
- Illiano et al., [2020] Illiano, D., Pop, I.S., Radu, F.A., 2020. Iterative schemes for surfactant transport in porous media. Comput. Geosci. https://doi.org/10.1007/s10596-020-09949-2
- Irving and Kirkwood, [1950] Irving, J.H., Kirkwood, J.G., 1950. The statistical mechanical theory of transport processes. IV. The equations of hydrodynamics. J. Chem. Phys., 18(6), 817–829. https://doi.org/10.1063/1.1747782
- Kumar et al., [2011] Kumar, K., Van Noorden, T.L., Pop, I.S., 2011. Effective dispersion equations for reactive flows involving free boundaries at the microscale. Multiscale Model. Simul., 9(1), 29–58. https://doi.org/10.1137/100804553
- Kumar et al., [2016] Kumar, K., Neuss-Radu, M., Pop, I.S., 2016. Homogenization of a pore scale model for precipitation and dissolution in porous media. IMA J. Appl. Math., 81(5), 877–897. https://doi.org/10.1093/imamat/hxw039
- List and Radu, [2016] List, F. and Radu, F.A., 2016. A study on iterative methods for solving Richards’ equation. Comput. Geosci. 20 (2), 341–353. https://doi.org/10.1007/s10596-016-9566-3
- Mailloux et al., [2003] Mailloux, B.J., Fuller, M.E., Rose, G.F., Onstott, T.C., DeFlaun, M.F., Alvarez, E., Hemingway, C., Hallet, R.B., Phelps, T.J., Griffin, T., 2003. A modular injection system, multilevel sampler, and manifold for tracer tests. Ground Water, 41(6), 816–27. http://dx.doi.org/10.1111/j.1745-6584.2003.tb0242
- McClure et al., [2017] McClure, J.E., Dye, A.L., Miller, C.T., Gray, W.G., 2017. On the consistency of scale among experiments, theory, and simulation. Hydrol. Earth Syst. Sci., 21(2), 1063. 10.5194/hess-21-1063-2017
- Nolen et al., [2008] Nolen, J., Papanicolaou, G., Pironneau, O., 2008. A framework for adaptive multiscale methods for elliptic problems. Multiscale Model. Simul., 7, 171–196. http://dx.doi.org/10.1137/070693230
- Nordbotten et al., [2007] Nordbotten, J.M., Celia, M.A., Dahle, H.K., Hassanizadeh, S.M., 2007. Interpretation of macroscale variables in Darcy’s law. Water Resour. Res., 43(8), W08430. http://dx.doi.org/10.1029/2006WR005018
- Pop et al., [2004] Pop, I.S., Radu, F.A., Knabner, P., 2004. Mixed finite elements for the Richards’ equation: linearization procedure. J. Comput. Appl. Math., 168 (1-2), 365–373. https://doi.org/10.1016/j.cam.2003.04.008
- Porta et al., [2012] Porta, G.M., Riva, M., Guadagnini, A., 2012. Upscaling solute transport in porous media in the presence of an irreversible bimolecular reaction. Adv. Water Resour., 35, 151–162. https://doi.org/10.1016/j.advwatres.2011.09.004
- Schüler et al., [2016] Schüler, L., Suciu, N., Knabner, P., Attinger, S. 2016. A time dependent mixing model to close PDF equations for transport in heterogeneous aquifers. Adv. Water Resour., 96, 55–67. http://dx.doi.org/10.1016/j.advwatres.2016.06.012
- Schwarze et al., [2001] Schwarze, H., Jaekel, U., Vereecken, H., 2001. Estimation of macrodispersion by different approximation methods for flow and transport in randomly heterogeneous media. Transp. Porous Media, 43(2), 265-287. https://doi.org/10.1023/A:1010771123844
- Schwede et al., [2008] Schwede, R.L., Cirpka, O.A., Nowak, W., Neuweiler, I., 2008. Impact of sampling volume on the probability density function of steady state concentration. Water Resour. Res., 44(12), W12433. http://dx.doi.org/10.1029/2007WR006668
- Skøien et al., [2003] Skøien, J.O., Blöschl, G., Western, A.W., 2003. Characteristic space scales and timescales in hydrology. Water Resour. Res., 39(10). http://dx.doi.org/10.1029/2002WR001736
- Sole-Mari and Fernàndez-Garcia, [2018] Sole-Mari, G., Fernàndez-Garcia, D., 2018, Lagrangian modeling of reactive transport in heterogeneous porous media with an automatic locally adaptive particle support volume, Water Resour. Res. 54(10), 8309–8331, http://dx.doi.org/10.1029/2018WR023033
- Sole-Mari et al., [2019] Sole-Mari, G., Bolster, D., Fernàndez-Garcia, D., Sanchez-Vila, X., 2019. Particle density estimation with grid-projected and boundary-corrected adaptive kernels. Adv. Water Resour. 131, 103382. https://doi.org/10.1016/j.advwatres.2019.103382
- Srzic et al., [2013] Srzic, V., Cvetkovic, V., Andricevic, R., Gotovac, H., 2013. Impact of aquifer heterogeneity structure and local-scale dispersion on solute concentration uncertainty. Water Resour. Res., 49(6), 3712–3728. http://dx.doi.org/10.1002/wrcr.20314
- Suciu, [2001] Suciu, N., 2001. On the connection between the microscopic and macoscopic modeling of the thermodynamic processes. Ed. Univ. Piteşti (in Romanian). English abstract: http://ictp.acad.ro/suciu/abstract-PhD-Thesis-Suciu.pdf.
- Suciu et al., [2015] Suciu, N., Radu, F.A., Attinger, S., Schüler, L., Knabner, P., 2015. A Fokker-Planck approach for probability distributions of species concentrations transported in heterogeneous media. J. Comput. Appl. Math., 289, 241–252. http://dx.doi.org/10.1016/j.cam.2015.01.030
- Suciu et al., [2016] Suciu, N., Schüler, L., Attinger, S., Knabner, P., 2016. Towards a filtered density function approach for reactive transport in groundwater. Adv. Water Resour., 90, 83–98. http://dx.doi.org/10.1016/j.advwatres.2016.02.016
- Suciu, [2019] Suciu, N., 2019. Diffusion in Random Fields. Applications to Transport in Groundwater. Birkhäuser, Cham. https://doi.org/10.1007/978-3-030-15081-5
- Suciu and Radu, [2022] Suciu, N., Radu, F.A., 2022. Global random walk solvers for reactive transport and biodegradation processes in heterogeneous porous media. Adv. Water Resour. 166, 104268. http://dx.doi.org/10.1016/j.advwatres.2022.104268
- Suciu et al., [2021] Suciu, N., Illiano, D., Prechtel, A., Radu, F.A., 2021. Global random walk solvers for fully coupled flow and transport in saturated/unsaturated porous media. Adv. Water Resour., 152, 103935. https://doi.org/10.1016/j.advwatres.2021.103935
- [46] Suciu, N., Radu, F.A., Pop, I.S., 2023a. https://github.com/PMFlow/SpaceTimeUpscaling. Git repository.
- [47] Suciu, N., Radu, F.A., Pop, I.S., 2023b, Space-time upscaling of reactive transport in porous media (extended version). Preprint arXiv.2112.10692. https://doi.org/10.48550/arXiv.2112.10692
- Teutsch et al., [2000] Teutsch, G., Ptak, T., Schwarz, R., Holder, T., 2000. Ein neues Verfahren zur Quantifizierung der Grundwasserimmission: I. Theoretische Grundlagen. Grundwasser, 4(5), 170–175. http://dx.doi.org/10.1007/s767-000-8368-7
- Tonina and Belin., [2008] Tonina, D., Bellin, A., 2008. Effects of pore-scale dispersion, degree of heterogeneity, sampling size, and source volume on the concentration moments of conservative solutes in heterogeneous formations. Adv. Water Resour., 31(2), 339–354. http://dx.doi.org/doi:10.1016/j.advwatres.2007.08.009
- Vamoş et al., [1996] Vamoş C., Georgescu A., Suciu N., Turcu I., 1996. Balance equations for physical systems with corpuscular structure. Phys. Stat. Mech. Appl., 227(1), 81–92. http://dx.doi.org/10.1016/0378-4371(95)00373-8.
- Vamoş et al., [1997] Vamoş C., Suciu N,, Georgescu, A., 1997. Hydrodynamic equations for one-dimensional systems of inelastic particles. Phys. Rev. E, 55(5), 6277–6280. http://doi.org/10.1103/PhysRevE.55.6277
- Vamoş et al., [2000] Vamoş, C., Suciu, N., Blaj, W., 2000. Derivation of one-dimensional hydrodynamic model for stock price evolution. Phys. Stat. Mech. Appl., 287(3), 461–467. http://dx.doi.org/10.1016/S0378-4371(00)00385-X
- Vamoş et al., [2003] Vamoş, C., Suciu, N., Vereecken, H., 2003. Generalized random walk algorithm for the numerical modeling of complex diffusion processes. J. Comput. Phys., 186, 527–544. https://doi.org/10.1016/S0021-9991(03)00073-1
- Vamoş, [2007] Vamoş C., 2007. Continuous fields associated to corpuscular systems. Risoprint, Cluj-Napoca (in Romanian). English version: http://ictp.acad.ro/vamos/cv-thesis/
- Van Duijn and van der Zee, [2018] Van Duijn, C.J., van der Zee, S.E.A.T.M., 2018. Large time behaviour of oscillatory nonlinear solute transport in porous media. Chemical Engineering Science, 183, 86-94. https://doi.org/10.1016/j.ces.2018.02.045
- Wiedemeier et al., [1999] Wiedemeier, T.H., Rifai, H.S., Newell, C.J., Wilson, J.T., 1999. Natural attenuation of fuels and chlorinated solvents in the subsurface. John Wiley & Sons.
- Wright et al., [2021] Wright, E. E., Sund, N. L., Richter, D. H., Porta, G. M., Bolster, D., 2021. Upscaling bimolecular reactive transport in highly heterogeneous porous media with the LAgrangian Transport Eulerian Reaction Spatial (LATERS) Markov model. Stoch. Environ. Res. Risk. Assess., 35, 1529–1547. https://doi.org/10.1007/s00477-021-02006-z
[1] Alecsa, C.D., Boros, I., Frank, F., Knabner, P., Nechita, M., Prechtel, A., Rupp, A., Suciu, N., 2019. Numerical benchmark study for fow in heterogeneous aquifers. Adv. Water Resour., 138, 103558. https://doi.org/10.1016/j.advwatres.2020.103558
[2] Andricevic R., 1998. Effects of local dispersion and sampling volume on the evolution of concentration fluctuations in aquifers. Water Resour. Res., 34(5):1115–29. http://dx.doi.org/10.1029/98WR00260
[3] de Barros, F.P.J., Fiori, A., 2014. First-order based cumulative distribution function for solute concentration in heterogeneous aquifers: Theoretical analysis and implications for human health risk assessment. Water Resour. Res., 50(5), 4018–4037. http://dx.doi.org/10.1002/2013WR015024
[4] Battiato, I. Multiscale dynamics of reactive fronts in heterogeneous media with fluctuating forcings. SIAM Conference on Mathematical and Computational Issues in the Geosciences September 11–14, 2017, Erlangen, Germany. https://archive.siam.org/meetings/gs17/program/invited-talks-prize-presentations/.
[5] Bayer-Raich, M., Jarsjo, J., Liedl, R., Ptak, T., Teutsch, G.2004. Average contaminant concentration and mass flow in aquifers from time-dependent pumping well data: Analytical framework. Water Resour. Res., 40(8), W08303. http://dx.doi.org/10.1029/2004WR003095
[6] Bause, M., Knabner, P., 2004. Numerical simulation of contaminant biodegradation by higher order methods and adaptive time stepping. Comput. Visual. Sci., 7(2), 61–78. https://doi.org/10.1007/s00791-004-0139-y
[7] Berkowitz, B., 2021. HESS Opinions: Chemical transport modeling in subsurface hydrological systems – Space, time, and the holy grail of “upscaling”. Hydrol. Earth. Syst. Sci. Discuss., [preprint]. https://doi.org/10.5194/hess-2021-537
[8] Brunner, F., Radu, F.A., Bause, M., Knabner, P., 2012. Optimal order convergence of a modified BDM1 mixed finite element scheme for reactive transport in porous media. Adv. Water Resour., 35, 163–171. http://dx.doi.org/10.1016/j.advwatres.2011.10.001
[9] Bringedal, C., Berre, I., Pop, I.S., Radu, F.A., 2015. A model for non-isothermal flow and mineral precipitation and dissolution in a thin strip. J. Comput. Appl. Math., 289, 346–355. https://doi.org/10.1016/j.cam.2014.12.009
[10] Bringedal, C., Berre, I., Pop, I. S., Radu, F. A., 2016. Upscaling of nonisothermal reactive porous media flow under dominant Peclet number: the effect of changing porosity. Multiscale Model. Simul. 14(1), 502–533. https://doi.org/10.1137/15M1022781
[11] Caroni, E., Fiorotto, V., 2005. Analysis of concentration as sampled in natural aquifers. Transport Porous Media, 59(1),19–45. http://dx.doi.org/10.1007/s11242-004-1119-x
[12] Cirpka, O.A., Frind, E.O., Helmig, R., 1999. Numerical simulation of biodegradation controlled by transverse mixing. J. Contam. Hydrol., 40(2), 159-182. https://doi.org/10.1016/S0169-7722(99)00044-3
[13] Cushman, J.H., 1983. Multiphase transport equations: I-general equation for macroscopic statistical, local space-time homogeneity. Transport Theor. Stat. Phys., 12(1), 35–71. http://dx.doi.org/10.1080/00411458308212731
[14] Destouni, G., Graham, W., 1997. The influence of observation method on local concentration statistics in the subsurface. Water Resour. Res., 33(4), 663–676. http://dx.doi.org/10.1029/96WR03955
[15] Eberhard, J.P., Suciu, N., Vamos, C., 2007. On the self-averaging of dispersion for transport in quasi-periodic random media. J. Phys. Math. Theor., 40(4), 597–610. https://doi.org/10.1088/1751-8113/40/4/002
[16] Gray, W.G., Miller, C.T., 2013. A generalization of averaging theorems for porous medium analysis. Adv. Water Resour. 62, 227–37. https://doi.org/10.1016/j.advwatres.2013.06.006
[17] Gray, W.G., Dye, A.L., McClure, J.E., Pyrak-Nolte, L.J., Miller, C.T., 2015. On the dynamics and kinematics of two-fluid-phase flow in porous media. Water Resour. Res., 51(7), 5365-81. https://doi.org/10.1016/10.1002/2015WR016921
[18] He, Y., Sykes, J.F., 1996. On the spatial-temporal averaging method for modeling transport in porous media. Transport Porous Media, 22(1), 1–51. https://doi.org/10.1007/BF00974310
[19] Hornung, U., 1996. Homogenization and porous media (Vol. 6). Springer Science & Business Media. https://link.springer.com/book/10.1007/978-1-4612-1920-0
[20] Illiano, D., Pop, I.S., Radu, F.A., 2020. Iterative schemes for surfactant transport in porous media. Comput. Geosci. https://doi.org/10.1007/s10596-020-09949-2
[21] Klofkorn, R., Kr¨oner, D., Ohlberger, M., 2002. Local adaptive methods for convection dominated problems. Int. J. Numer. Meth. Fluid., 40(1-2), 79–91. https://doi.org/10.1002/fld.268
[22] Kumar, K., Van Noorden, T.L., Pop, I.S., 2011. Effective dispersion equations for reactive flows involving free boundaries at the microscale. Multiscale Model. Simul., 9(1), 29–58. https://doi.org/10.1137/100804553
[23] Kumar, K., Neuss-Radu, M., Pop, I.S., 2016. Homogenization of a pore scale model for precipitation and dissolution in porous media. IMA J. Appl. Math., 81(5), 877–897. https://doi.org/10.1093/imamat/hxw039
[24] List, F. and Radu, F.A., 2016. A study on iterative methods for solving Richards’ equation. Comput. Geosci. 20 (2), 341–353. https://doi.org/10.1007/s10596-016-9566-3
[25] Mailloux B.J., Fuller, M.E., Rose, G.F., Onstott, T.C., DeFlaun, M.F., Alvarez, E., Hemingway, C., Hallet, R.B., Phelps, T.J., Griffin, T., 2003. A modular injection system, multilevel sampler, and manifold for tracer tests. Ground Water, 41(6), 816–27. http://dx.doi.org/10.1111/j.1745-6584.2003.tb0242
[26] McClure, J.E., Dye, A.L., Miller, C.T., Gray, W.G., 2017. On the consistency of scale among experiments, theory, and simulation. Hydrol. Earth Syst. Sci., 21(2), https://doi.org/10.5194/hess-21-1063-2017
[27] Nolen, J., Papanicolaou, G., Pironneau, O., 2008. A framework for adaptive multiscale methods for elliptic problems. Multiscale Model. Simul., 7, 171–196. http://dx.doi.org/10.1137/070693230
[28] Nordbotten, J.M., Celia, M.A., Dahle, H.K., Hassanizadeh, S.M., 2007. Interpretation of macroscale variables in Darcy’s law. Water Resour. Res., 43(8), W08430. http://dx.doi.org/10.1029/2006WR005018
[29] Pop, I.S., Radu, F.A., Knabner, P., 2004. Mixed finite elements for the Richards’ equation: linearization procedure. Journal of computational and applied mathematics 168 (1-2), 365–373. https://doi.org/10.1016/j.cam.2003.04.008
[30] Porta, G.M., Riva, M., Guadagnini, A., 2012. Upscaling solute transport in porous media in the presence of an irreversible bimolecular reaction. Adv. Water Resour., 35, 151–162. https://doi.org/10.1016/j.advwatres.2011.09.004
[31] Schuler, L., Suciu, N., Knabner, P., Attinger, S. 2016. A time dependent mixing model to close PDF equations for transport in heterogeneous aquifers. Adv. Water Resour., 96:55–67. http://dx.doi.org/10.1016/j.advwatres.2016.06.012
[32] Schwarze, H., Jaekel, U., Vereecken, H., 2001. Estimation of macrodispersion by different approximation methods for flow and transport in randomly heterogeneous media. Transport Porous Media, 43(2), 265-287. https://doi.org/10.1023/A:1010771123844
[33] Schwede, R.L., Cirpka, O.A., Nowak, W., Neuweiler, I., 2008. Impact of sampling volume on the probability density function of steady state concentration. Water Resour. Res., 44(12), W12433. http://dx.doi.org/10.1029/2007WR006668
[34] Skøien, J.O., Bloschl, G., Western, A.W., 2003. Characteristic space scales and timescales in hydrology. Water Resour. Res., 39(10). http://dx.doi.org/10.1029/2002WR001736
[35] Srzic, V., Cvetkovic, V., Andricevic, R., Gotovac, H., 2013. Impact of aquifer heterogeneity structure and local-scale dispersion on solute concentration uncertainty. Water Resour. Res., 49(6), 3712–3728. http://dx.doi.org/10.1002/wrcr.20314
[36] Suciu N., 2001. On the connection between the microscopic and macoscopic modeling of the thermodynamic processes. Ed. Univ. Pitesti (in Romanian). English abstract: http://www1.am.uni-erlangen.de/suciu/Rabsth.pdf.
[37] Suciu, .N, Radu, F.A., Attinger, S., Sch¨uler, L., Knabner, P., 2015. A Fokker-Planck approach for probability distributions of species concentrations transported in heterogeneous media. J. Comput. Appl. Math., 289, 241–252. http://dx.doi.org/10.1016/j.cam.2015.01.030
[38] Suciu, N., Schuler, L., Attinger, S., Knabner, P., 2016. Towards a filtered density function approach for reactive transport in groundwater. Adv. Water Resour., 90, 83–98. http://dx.doi.org/10.1016/j.advwatres.2016.02.016
[39] Suciu, N., 2019. Diffusion in Random Fields. Applications to Transport in Groundwater. Birkhauser, Cham. https://doi.org/10.1007/978-3-030-15081-5
[40] Suciu, N., Illiano, D., Prechtel, A., Radu, F.A., 2021. Global random walk solvers for fully coupled flow and transport in saturated/unsaturated porous media. Adv. Water Resour., 152, 103935. https://doi.org/10.1016/j.advwatres.2021.103935
[41] Suciu, N., Radu, F.A., 2021. Global random walk solvers for reactive transport and biodegradation processes in heterogeneous porous media. arXiv: 2107.08745
[42] Suciu, N., Radu, F.A., 2021. https://github.com/PMFlow/MonodReactions. Git repository. https://doi.org/10.5281/zenodo.5104076
[43] Suciu, N., Radu, F.A., 2021. https://github.com/PMFlow/SpaceTimeUpscaling. Git repository.
[44] Teutsch, G., Ptak, T., Schwarz, R., Holder, T., 2000. Ein neues Verfahren zur Quantifizierung der Grundwasserimmission: I. Theoretische Grundlagen. Grundwasser, 4(5):170–175. http://dx.doi.org/10.1007/s767-000-8368-7
[45] Tonina, D., Bellin, A., 2008. Effects of pore-scale dispersion, degree of heterogeneity, sampling size, and source volume on the concentration moments of conservative solutes in heterogeneous formations. Adv. Water Resour., 31(2), 339–354. http://dx.doi.org/doi:10.1016/j.advwatres.2007.08.009
[46] Vamos C., Georgescu A., Suciu N., Turcu I., 1996. Balance equations for physical systems with corpuscular structure. Phys. Stat. Mech. Appl., 227(1), 81–92. http://dx.doi.org/10.1016/0378-4371(95)00373-8
[47] Vamos C., Suciu N,, Georgescu, A., 1997. Hydrodynamic equations for one-dimensional systems of inelastic particles. Phys. Rev. E, 55(5), 6277–6280. http://doi.org/10.1103/PhysRevE.55.6277
[48] Vamos, C., Suciu, N., Peculea, M., 1997. Numerical modelling of the one-dimensional diffusion by random walkers. Rev. Anal. Numer. Theor. Approx., 26(1), 237–247. https://ictp.acad.ro/jnaat/journal/article/view/1997-vol26-nos1-2-art32.
[49] Vamos, C., Suciu, N., Blaj, W., 2000. Derivation of one-dimensional hydrodynamic model for stock price evolution. Phys. Stat. Mech. Appl., 287(3), 461–467. http://dx.doi.org/10.1016/S0378-4371(00)00385-X
[50] Vamos, C., Suciu, N., Vereecken, H., 2003. Generalized random walk algorithm for the numerical modeling of complex diffusion processes. J. Comput. Phys., 186, 527–544. https://doi.org/10.1016/S0021-9991(03)00073-1
[51] Vamos C., 2007. Continuous fields associated to corpuscular systems. Risoprint, Cluj-Napoca (in Romanian). English version: https://ictp.acad.ro/vamos/cv-thesis/
[52] Wiedemeier, T.H., Rifai, H.S., Newell, C.J., Wilson, J.T., 1999. Natural attenuation of fuels and chlorinated solvents in the subsurface. John Wiley & Sons.
[53] Wright, E. E., Sund, N. L., Richter, D. H., Porta, G. M., Bolster, D., 2021. Upscaling bimolecular reactive transport in highly heterogeneous porous media with the LAgrangian Transport Eulerian Reaction Spatial (LATERS) Markov model. Stoch. Environ. Res. Risk. Assess., 35, 1529–1547. https://doi.org/10.1007/s00477-021-02006-z
