Abstract
Authors
C. Andronache
Boston College, 140 Commonwealth Ave., Chestnut Hill, Massachusetts, United States of America
Tiberiu Popoviciu Institute of Numerical Analysis, Romanian Academy
“Babes-Bolyai” University, Faculty of Mathematics and Computer Science
Keywords
Time series; quasi-periodicity; trend, non-stationarity.
References
See the expanding block below.
Paper coordinates
C. Andronache, N. Suciu, C. Vamoş, On the multi-decadal oscillation of Atlantic tropical storm activity, Rev. Anal. Numér. Théor. Approx., 37 (2008) no. 2, pp. 109-117
About this paper
Journal
Rev. Anal. Numer. Theor. Approx.
Publisher Name
Editura Academiei Romane
paper on journal website
https://doi.org/10.33993/jnaat372-882
https://ictp.acad.ro/jnaat/journal/article/view/2002-vol31-no2-art6
Print ISSN
1222-9024
Online ISSN
2457-8126
Google Scholar Profile
soon
[1] Bell, G. D. et al., Climate assessment for 1999, Bull. Amer. Meteor. Soc., 81, 1328, 1999.
[2] Efron, B., Bootstrap Methods: Another Look at the Jackknife, The Annals of Statistics 7 (1), pp. 1-26. doi: 10.1214/aos/1176344552, 1979.
[3] Emanuel, K. E., Increasing destructiveness of tropical cyclones over the past 30 years, Nature, 436, pp. 686-688, 2005.
[4] Goldenberg, S. B., Landsea, C. W., Mestas-Nuñez, A. M. and Gray, W. M., The recent increase in Atlantic hurricane activity: Causes and implications, Science, 293, pp. 474–479, 2001.
[5] Gray, W., Sheaffer, J. D. and Landsea, C. W., Climate trends associated with multi-decadal variability of Atlantic hurricane activity. Hurricanes: Climate and Socioeconomic Impacts, H. F. Diaz and R. S. Pulwarty, Eds., Springer-Verlag, pp. 15-52, 1997.
[6] Kantz, H. and Schreiber, T., Nonlinear Time Series Analysis, Cambridge Univ. Press, pp. 369, 2004.
[7] Kaplan, A., Cane, M., Kushnir, Y., Clement, A., Blumenthal, M. and Rajagopalan, B., Analyses of global sea surface temperature 1856-1991, J. Geophys. Res, 103, pp. 18567-18589, 1998.
[8] Kerr, R. A., A North Atlantic climate pacemaker for the centuries, Science, 288, pp. 1984-1985, 2000.
[9] Klotzbach, P. J. and Gray, W. M., Causes of the unusually destructive 2004 Atlantic basin hurricane season, BAMS, pp. 1325-1333, 2006.
[10] Knight, Jeff. R., Robert J. Allan, Folland, Chris K. Vellinga, Michael and Mann, Michael E., A signature of persistent natural thermohaline circulation cycles in observed climate, Geophys. Res. Lett., 32, L20708, doi: 10.1029/2005GL024233, 2005.
[11] Knutson, T. R., Tuleya, R. E., Shen, W. and Ginis, I., Impact of CO₂-Induced Warming on Hurricane Intensities as Simulated in a Hurricane Model with Ocean Coupling, J. of Climate, 14, pp. 2458-2468, 2000.
[12] Landsea, C. W., Anderson, C., Charles, N., Clark, G. Dunion, J., Fernandez-Partagas, J., Hungerford, P., Neumann, C. and Zimmer, M., The Atlantic hurricane database re-analysis project: Documentation for the 1851-1910 alterations and additions to the HURDAT database. Hurricanes and Typhoons: Past, Present and Future, R. J. Murname and K.-B. Liu, Eds., Columbia University Press, pp. 177-221, 2004.
[13] Landsea, C. W., Counting Atlantic tropical cyclones back to 1900, EOS, 88, pp. 197-202, 2007.
[14] Parker, D.E., Jones, P.D., Folland, C.K. and Bevan, A., Interdecadal changes of surface temperature since the late nineteenth century, J. Geophys. Res., 99, p. 14373-14399, 1994.
[15] Pielke, R. A. Rr., Landsea, C., Mayfield, M., Laver, J. and Pasch, R., Hurricanes and global warming, doi: 10.1175/bams-86-11-1571, Bull. Amer. Meteo. Soc., 2005.
[16] Reynolds, R.W. and Smith, T.M., Improved global sea surface temperature analysis using optimum interpolation, J. Climate, 7, pp. 929-948, 1994.
[17] Saffir, H. and Simpson, R., The hurricane disaster potential scale, Weatherwise, 27, pp. 169-186, 1974.
[18] Sutton, R. T. and Hodson, Daniel L. R., Atlantic Ocean Forcing of North American and European Summer Climate, Science, 309, pp. 115-118, 2005.
[19] Trenberth, K., Uncertainty in hurricanes and global warming, Science, 308, pp. 1753–1754, 2005.
[20] Vamoş, C., Automatic algorithm for monotone trend removal, Physical Review E 75, 036705, DOI: 10.1103/PhysRevE.75.03670, 2007.
Paper in HTML form
REVUE D'ANALYSE NUMÉRIQUE ET DE THÉORIE DE L'APPROXIMATION
ON THE MULTI-DECADAL OSCILLATION OF ATLANTIC TROPICAL STORM ACTIVITY
Abstract
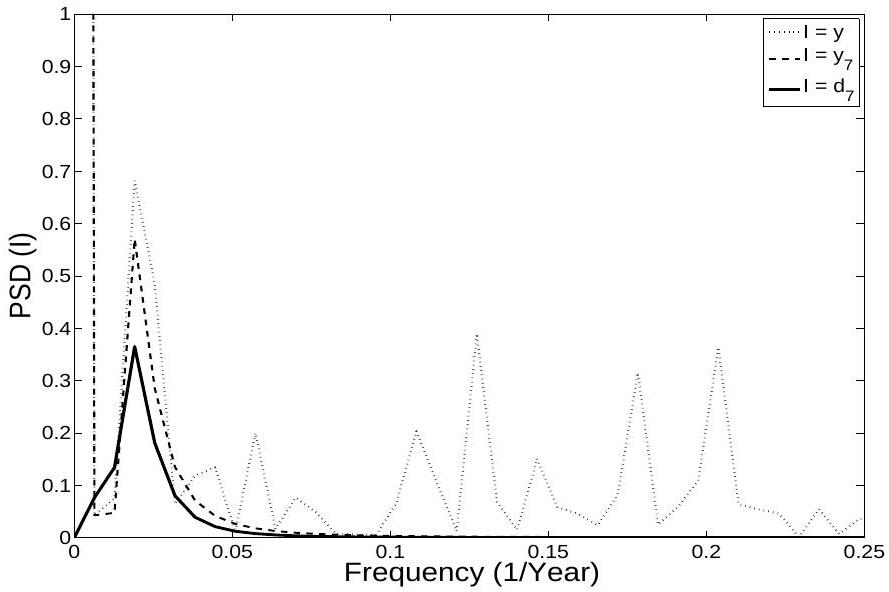
Long term Atlantic tropical storm activity is described by the time series of the yearly Accumulated Cyclone Energy (ACE) Index for the time interval 1851-2007. ACE is a measure of total wind energy for North Atlantic basin and land falling tropical cyclone activity. Since the ACE index reflects a combination of storm intensity and duration it is a better measure of overall activity and likely damage than the number of either basin or land falling tropical storms or hurricanes. The yearly ACE time series is non-stationary, and one step toward detecting possible long-term quasi-periods is to detrend the original data. In this paper, we use a procedure for data transformation by which ACE index is fitted in least square sense with polynomials of increasing order, followed by detrend. It is shown that, with some approximation, the obtained time series is cyclostationary, and a multi-decadal oscillation is detectable, as indicated by the power spectrum analysis.
Keywords. Time series, quasi-periodicity, trend, non-stationarity.
1. INTRODUCTION
2. METHOD
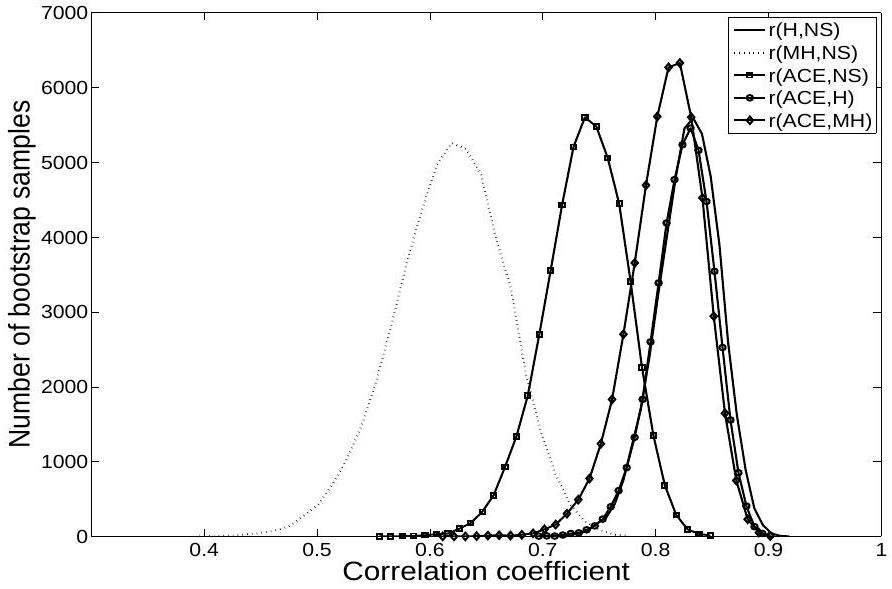
statistical technique for estimating the sampling distribution of an estimator by sampling with replacement from the original sample set (Figure 1). The purpose is to derive robust estimates of the correlation coefficient [2].
3. RESULTS
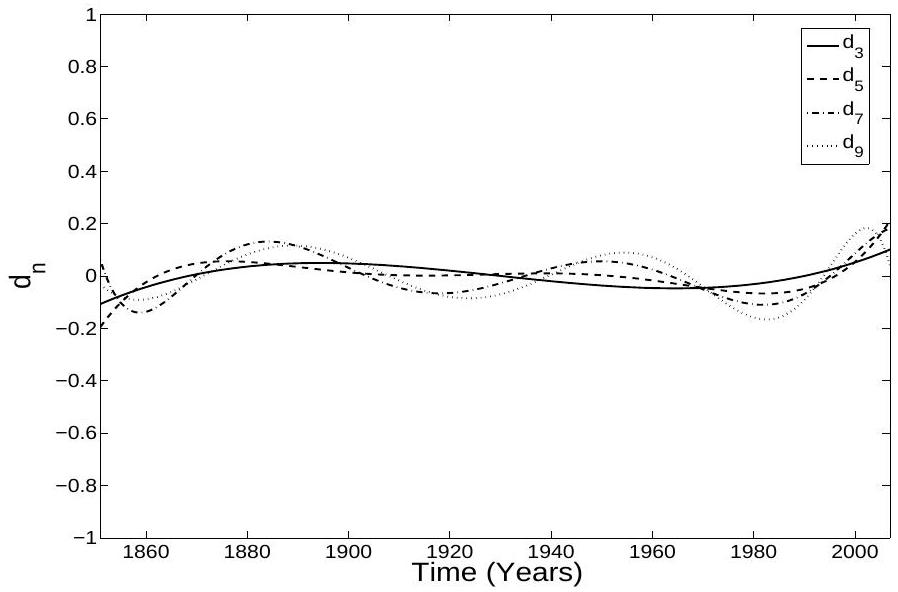
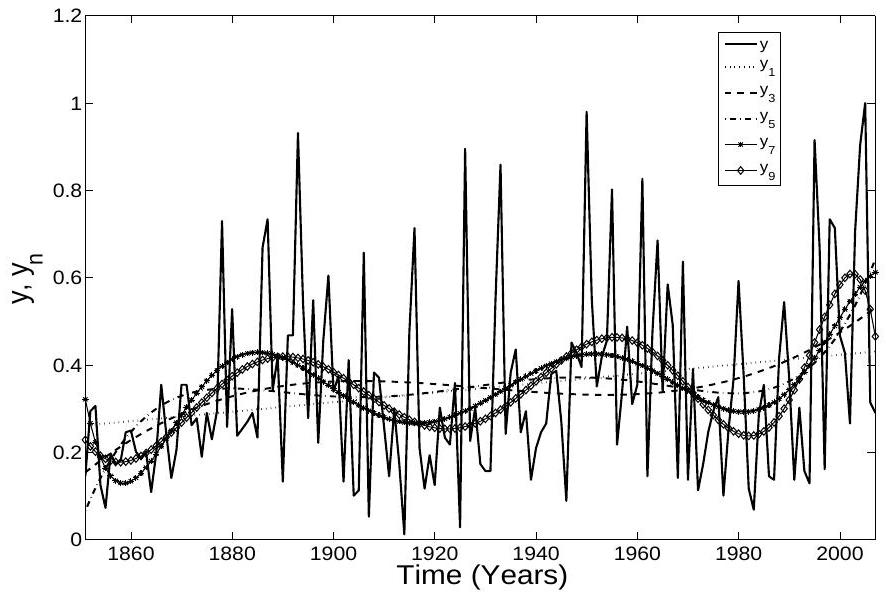
the original data set. The method used to generate these approximations of
4. CONCLUSIONS
has potential applications in time series analysis that manifest low-frequency signals, masked by more intense high frequency signals.
REFERENCES
[2] Efron, B., Bootstrap Methods: Another Look at the Jackknife, The Annals of Statistics 7 (1), pp. 1-26. doi: 10.1214/aos/1176344552, 1979.
[3] Emanuel, K. E., Increasing destructiveness of tropical cyclones over the past 30 years, Nature, 436, pp. 686-688, 2005.
[4] Goldenberg, S. B., Landsea, C. W., Mestas-Nuñez, A. M. and Gray, W. M., The recent increase in Atlantic hurricane activity: Causes and implications, Science, 293, pp. 474-479, 2001.
[5] Gray, W., Sheaffer, J. D. and Landsea, C. W., Climate trends associated with multi-decadal variability of Atlantic hurricane activity. Hurricanes: Climate and Socioeconomic Impacts, H. F. Diaz and R. S. Pulwarty, Eds., Springer-Verlag, pp. 15-52, 1997.
[6] Kantz, H. and Schreiber, T., Nonlinear Time Series Analysis, Cambridge Univ. Press, pp. 369, 2004.
[7] Kaplan, A., Cane, M., Kushnir, Y., Clement, A., Blumenthal, M. and Rajagopalan, B., Analyses of global sea surface temperature 1856-1991, J. Geophys. Res, 103, pp. 18567-18589, 1998.
[8] Kerr, R. A., A North Atlantic climate pacemaker for the centuries, Science, 288, pp. 1984-1985, 2000.
[9] Klotzbach, P. J. and Gray, W. M., Causes of the unusually destructive 2004 Atlantic basin hurricane season, BAMS, pp. 1325-1333, 2006.
[10] Knight, Jeff. R., Robert J. Allan, Folland, Chris K. Vellinga, Michael and Mann, Michael E., A signature of persistent natural thermohaline circulation cycles in observed climate, Geophys. Res. Lett., 32, L20708, doi: 10.1029/2005GL024233, 2005.
[11] Knutson, T. R., Tuleya, R. E., Shen, W. and Ginis, I., Impact of
[12] Landsea, C. W., Anderson, C., Charles, N., Clark, G. Dunion, J., FernandezPartagas, J., Hungerford, P., Neumann, C. and Zimmer, M., The Atlantic hurricane database re-analysis project: Documentation for the 1851-1910 alterations and additions to the HURDAT database. Hurricanes and Typhoons: Past, Present and Future, R. J. Murname and K.-B. Liu, Eds., Columbia University Press, pp. 177-221, 2004.
[13] Landsea, C. W., Counting Atlantic tropical cyclones back to 1900, EOS, 88, pp. 197202, 2007.
[14] Parker, D.E., Jones, P.D., Folland, C.K. and Bevan, A., Interdecadal changes of surface temperature since the late nineteenth century, J. Geophys. Res., 99, p. 1437314399, 1994.
[15] Pielke, R. A. Rr., Landsea, C., Mayfield, M., Laver, J. and Pasch, R., Hurricanes and global warming, doi: 10.1175/bams-86-11-1571, Bull. Amer. Meteo. Soc., 2005.
[16] Reynolds, R.W. and Smith, T.M., Improved global sea surface temperature analysis using optimum interpolation, J. Climate, 7, pp. 929-948, 1994.
[17] Saffir, H. and Simpson, R., The hurricane disaster potential scale, Weatherwise, 27, pp. 169-186, 1974.
[18] Sutton, R. T. and Hodson, Daniel L. R., Atlantic Ocean Forcing of North American and European Summer Climate, Science, 309, pp. 115-118, 2005.
[19] Trenberth, K., Uncertainty in hurricanes and global warming, Science, 308, pp. 17531754, 2005.
[20] Vamoş, C., Automatic algorithm for monotone trend removal, Physical Review E 75, 036705, DOI: 10.1103/PhysRevE.75.03670, 2007.
- *Boston College, 140 Commonwealth Ave., Chestnut Hill, Massachusetts, United States of America, e-mail: andronac@bc.edu.
†"Tiberiu Popoviciu" Institute of Numerical Analysis, Romanian Academy, 400320 ClujNapoca, P. O. Box 68-1, Romania, also at Friedrich-Alexander University of ErlangenNuremberg, Institute of Applied Mathematics, Martensstr. 3, 91058 Erlangen, Germany, e-mail: n.suciu@fz-juelich.de.
«"Tiberiu Popoviciu" Institute of Numerical Analysis, Romanian Academy, 400320 ClujNapoca, P. O. Box 68-1, Romania, e-mail: cvamos@ictp.acad.ro.